The Headache of Manual Support and Resistance
Ask any trader what the most critical skill in technical analysis is, and nine out of ten will say identifying support and resistance. It sounds simple enough: find where the price stopped falling and where it stopped rising. But when you actually open a live chart in 2026, the reality is far messier. Trends are jagged, noise is everywhere, and what looks like a solid floor to one trader looks like a temporary pause to another.
This subjectivity is exactly why many traders find themselves second-guessing their entries. Manual lines are prone to human bias. We often draw lines where we want the market to turn, rather than where the data suggests it will. This is where the Fractal Support and Resistance MT4 indicator steps in, acting as a mathematical filter that strips away the emotional guesswork and highlights the levels that actually matter.
Defining the Fractal: More Than Just a Math Pattern
To understand the indicator, we first have to look at the concept of the fractal itself. Popularized by the legendary trader Bill Williams, a fractal isn’t just a fancy geometric term. In the context of trading, it represents a specific behavioral pattern of the market participants. It marks a moment where the market attempted to move in one direction, failed, and then reversed.
The Anatomy of a Fractal
A basic fractal is composed of a sequence of five consecutive bars (or candles). For a ‘Up’ fractal, you need a high point surrounded by two lower highs on each side. Conversely, a ‘Down’ fractal is a low point surrounded by two higher lows on each side. When this pattern completes, it signals that the market has established a temporary peak or trough.
By themselves, these little arrows on your chart can seem like noise. However, when you connect these points over time, they form horizontal levels of support and resistance that are far more reliable than arbitrary lines drawn by a tired human eye.
How the Fractal Support and Resistance MT4 Indicator Operates
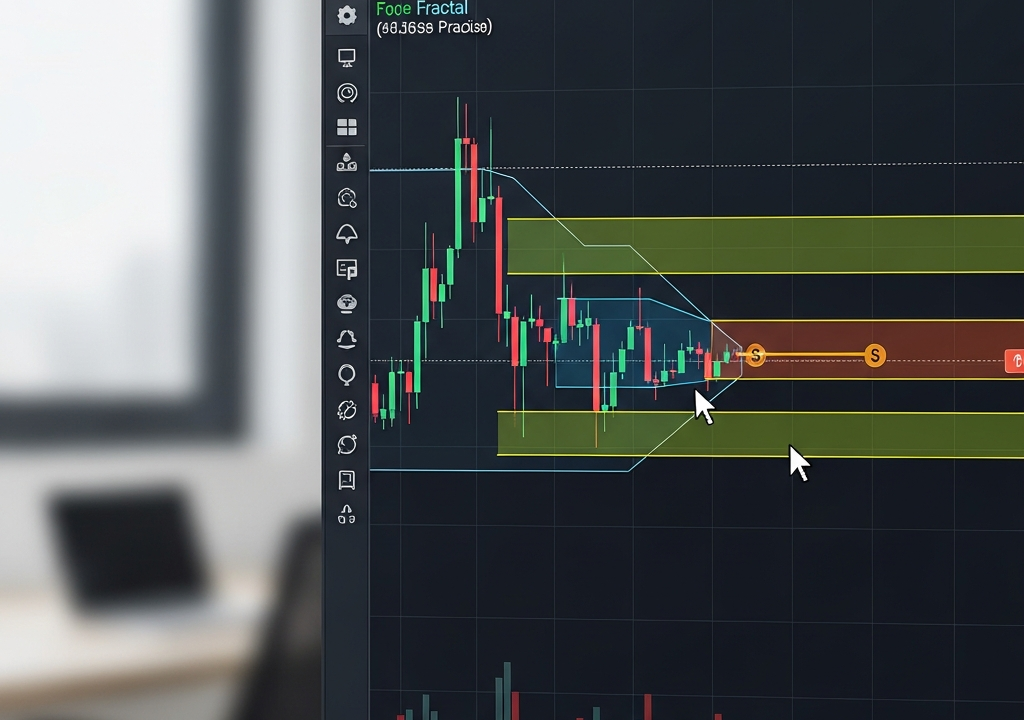
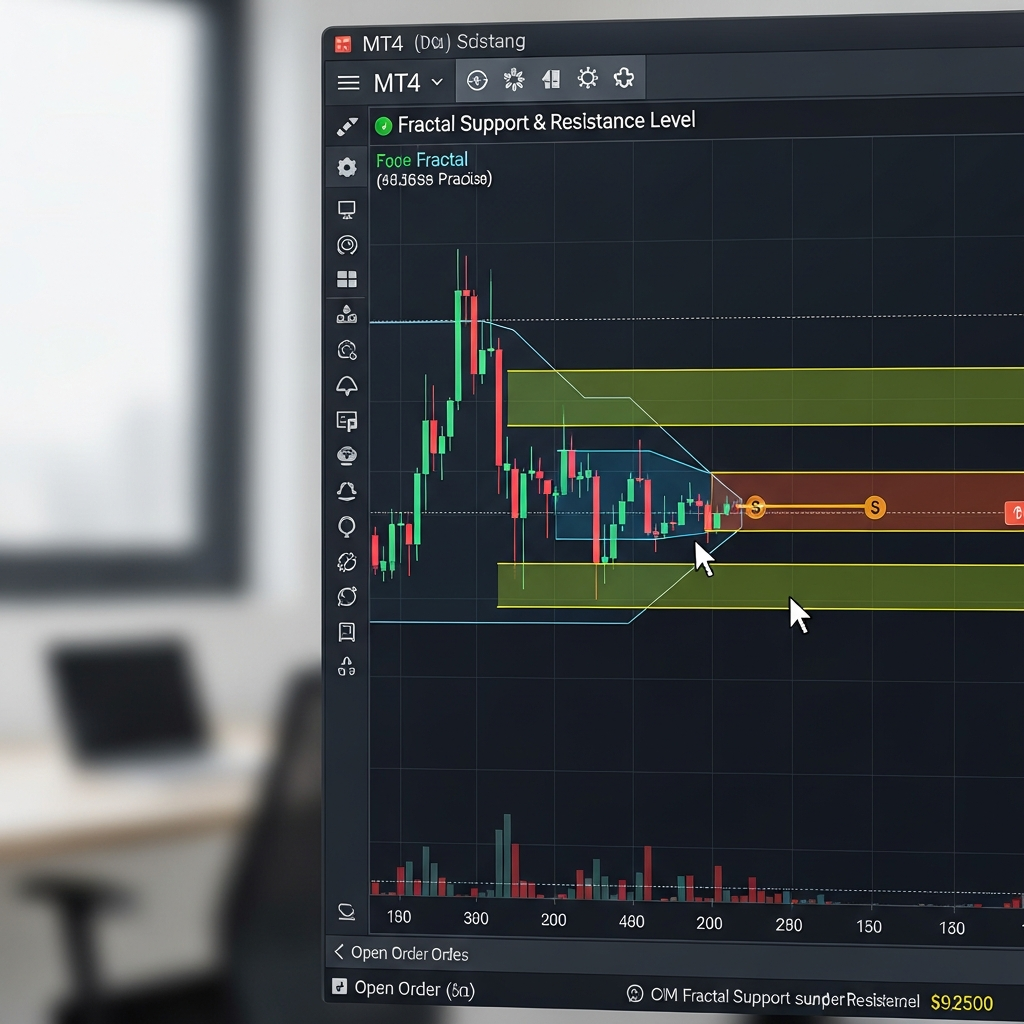
The Fractal Support and Resistance indicator for MetaTrader 4 takes the raw fractal data and cleans it up for the modern trader. Instead of just showing you every single fractal that appears, this tool identifies the most significant ones and projects them forward as horizontal lines. This creates a visual ‘zone’ or ‘level’ that the price is likely to react to in the future.
The beauty of this indicator lies in its automation. As new fractals form, the indicator updates the support and resistance levels in real-time. This ensures that you are always looking at the most current market structure. It effectively turns a cluttered chart into a clear roadmap of where the ‘big money’ is likely to step in or exit.
Turning Signals into Practical Trades
Having lines on your chart is one thing; knowing how to trade them is another. The Fractal Support and Resistance indicator is versatile, but it shines in two specific scenarios: breakouts and range bounces.
Identifying Breakouts with Confidence
A breakout occurs when the price pushes through a long-standing fractal resistance level. Many traders fail because they jump into every candle that looks strong. By using the fractal indicator, you have a specific price point to watch. If a candle closes decisively above a fractal resistance line, it suggests that the balance of power has shifted, and a new bullish trend may be starting. This provides a much more objective entry signal than simply ‘feeling’ that the price is high enough.
Setting Smarter Stop Losses
Risk management is where the fractal indicator often becomes a trader’s best friend. When you enter a long position, where should your stop loss go? Placing it just below the most recent fractal support level provides a logical exit point. If the price breaks that fractal, the original reason for your trade is no longer valid. This method prevents you from setting stops that are too tight (getting stopped out by noise) or too wide (risking too much capital).
Dealing with the Noise: Best Timeframes for Fractal Trading
One of the biggest mistakes traders make with fractals is trying to use them on the 1-minute or 5-minute charts without any higher-timeframe context. Because fractals are based on a 5-bar pattern, they appear constantly on lower timeframes, leading to a lot of ‘false’ support and resistance levels.
To get the most out of this indicator, it is generally recommended to use it on the H1 (1-hour), H4 (4-hour), or Daily charts. On these timeframes, a fractal represents a significant shift in sentiment that lasted for hours or days, making the resulting support and resistance lines much more ‘sticky’ and reliable. If you are a day trader, try looking at the H4 fractal levels and only taking trades on the M15 chart that align with those major levels.

Pairing Fractals with Other Technical Tools
No indicator is a crystal ball, and the Fractal Support and Resistance indicator is no exception. It works best when it is part of a broader strategy. Here are a few ways to filter out the bad signals:
- Combine with Moving Averages: Only take long trades off a fractal support level if the price is also above a long-term moving average (like the 200-period EMA). This ensures you are trading with the overall trend.
- Watch the RSI: If the price is hitting a fractal resistance level and the Relative Strength Index (RSI) is showing bearish divergence, the likelihood of a reversal is much higher.
- Volume Confirmation: Look for an increase in trading volume as the price approaches or breaks a fractal level. High volume confirms that other market participants are seeing the same level you are.
Common Pitfalls and How to Avoid Them
The most common complaint about fractals is that they ‘repaint’ or appear late. Remember, a fractal requires two candles to form after the high or low point. This means the fractal arrow only appears on the chart two candles after the actual peak occurred. This isn’t a flaw; it’s a confirmation requirement.
To avoid being caught off guard, don’t trade the moment an arrow appears. Instead, use the horizontal lines generated by the indicator as your primary guide. These lines represent historical levels that have already been confirmed. Treat them as zones of interest rather than magical barriers that the price can never cross.
Setting Up the Indicator in Your MT4 Terminal
Installing the Fractal Support and Resistance MT4 indicator is straightforward. Once you have the .ex4 or .mq4 file, you simply move it into your ‘Indicators’ folder within the MetaTrader 4 data directory. After restarting the platform, you can drag it onto any chart.
Most versions of this indicator allow you to customize the colors and thickness of the lines. It is helpful to set support lines to a different color (like green) and resistance lines to another (like red) to keep your visual analysis quick and efficient. Some advanced versions even offer push notifications or email alerts when a level is breached, which is a massive time-saver for traders who can’t stare at screens all day.
Final Thoughts on Fractal Logic
In a trading world increasingly dominated by complex algorithms and high-frequency bots, there is something refreshing about the simplicity of fractals. They tap into the basic rhythm of the market—the pulse of expansion and contraction. By using the Fractal Support and Resistance MT4 indicator, you aren’t just adding another tool to your chart; you are adopting a systematic way to view market structure. It forces you to be patient, wait for confirmation, and trade only when the price action proves that a level is truly significant.