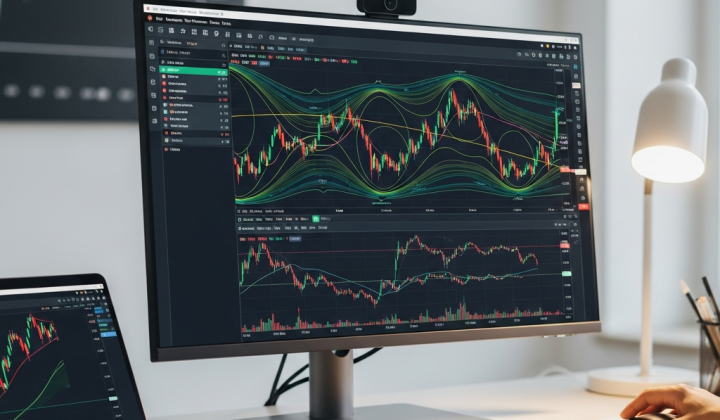

Understanding the Geometry of the Market
In the fast-paced world of 2026 currency trading, the noise can be deafening. Between algorithmic surges and geopolitical shifts, finding a clear entry point often feels like trying to catch a falling knife. This is where the Reversal Fractals indicator for MetaTrader 4 steps in. Based on the foundational work of Bill Williams, fractals aren’t just random arrows on a chart; they represent the underlying geometry of market behavior. They highlight specific moments where the price has attempted to push in one direction, failed, and then retreated, creating a structural ‘peak’ or ‘trough’.
Most traders see a fractal and think it’s a simple buy or sell signal. However, the true power of this tool lies in its ability to map out support and resistance levels dynamically. By identifying these five-bar patterns, you aren’t just looking at a price change—you’re looking at the exhaustion of one side of the market and the potential emergence of the other.
The Anatomy of a Reversal Fractal
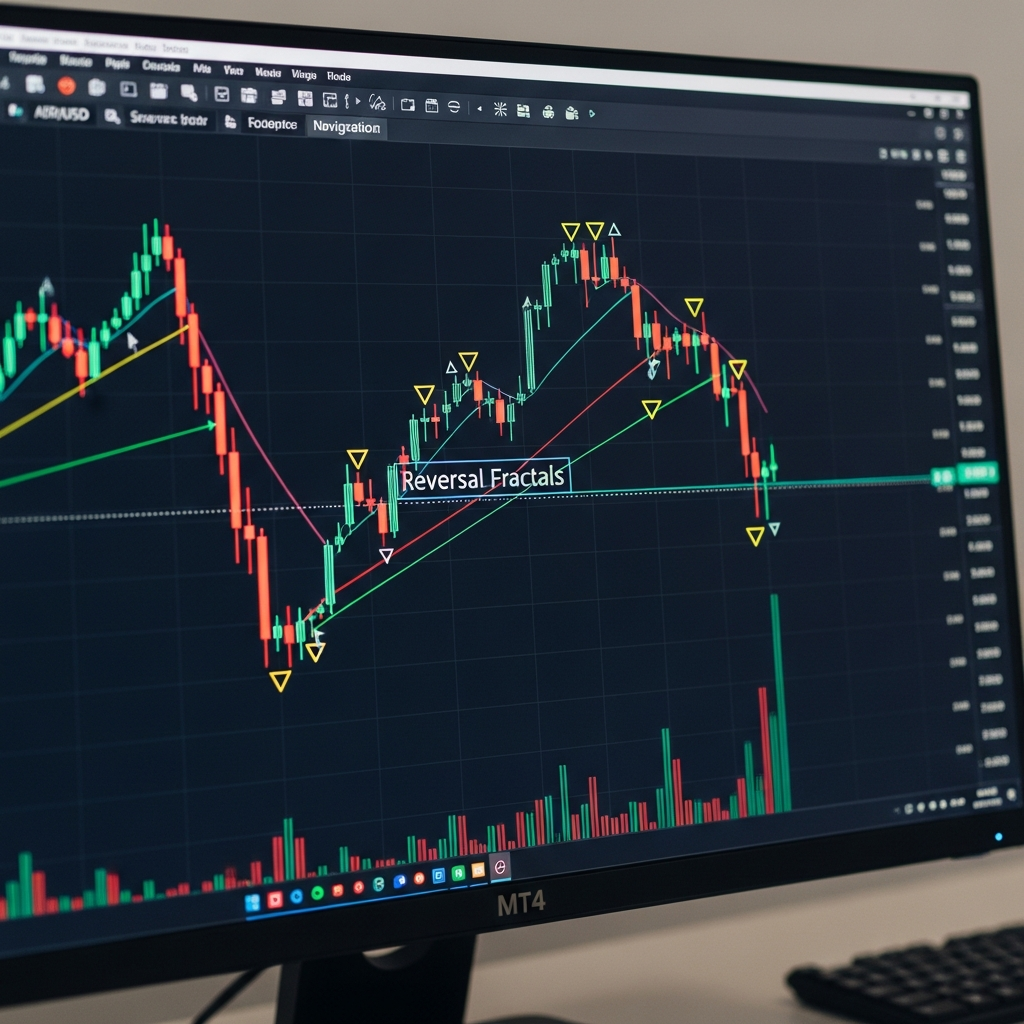
To use this tool effectively, you have to understand what the indicator is actually looking for. A standard fractal is a sequence of at least five consecutive bars. For a bearish reversal (an up fractal), you need a high bar in the middle, preceded by two lower highs and followed by two lower highs. Conversely, a bullish reversal (a down fractal) requires a low bar in the middle, flanked by two higher lows on either side.
- The Peak: The middle bar represents the absolute limit of the current momentum.
- The Confirmation: The two bars following the peak confirm that the market no longer has the strength to test that high or low.
- The Visual: On MT4, these are usually marked with small arrows above or below the candles.
Setting Up the Indicator on MT4
Installing the Reversal Fractals indicator is straightforward, but how you configure it makes all the difference. Unlike standard oscillators that might require complex period settings, fractals are largely mathematical constants. However, in the current 2026 market environment, many traders prefer custom versions that include ‘noise filters’ or ‘alert’ functions.
Once you have the indicator file, simply move it into your MQL4 ‘Indicators’ folder and restart your platform. When you drag it onto your chart, you’ll notice it works across all timeframes. However, a common mistake is using it on 1-minute charts where the ‘noise’ is too high. For more reliable reversals, the 1-hour (H1) or 4-hour (H4) timeframes are generally preferred by seasoned price-action traders.
Why Fractals Are Lagging (And Why That’s Okay)
One of the first things you’ll realize is that a fractal arrow doesn’t appear until two bars after the high or low. This means the indicator is technically ‘lagging’. While some traders see this as a disadvantage, it is actually a built-in safety mechanism. The lag ensures that the reversal is real and not just a momentary spike. In trading, being ‘right’ too early is often the same as being wrong. The Reversal Fractals indicator forces you to wait for a sliver of confirmation before you commit your capital.
A Practical Strategy for 2026
You shouldn’t trade every fractal you see. If you did, your account would likely be eroded by commissions and whipsaws. Instead, treat the Reversal Fractals as a component of a broader strategy. A popular method involves combining fractals with a trend-following tool, such as a 50-period Exponential Moving Average (EMA).
The Trend-Filter Approach
In a trending market, you only want to take reversals that align with the larger flow. If the price is trading above the 50 EMA, look for bullish (down) fractals that form as price dips toward the moving average. This suggests a temporary pullback is ending and the uptrend is ready to resume. You are essentially using the ‘reversal’ indicator to time your entry into the ‘continuation’ of the main trend.
For a short trade, the opposite applies. If price is below the 50 EMA, wait for a bearish (up) fractal to form during a relief rally. When the arrow appears, it signals that the buyers have exhausted themselves and the bears are taking back control.

Managing Your Risk
The beauty of fractal trading is that it provides natural levels for your stop-loss orders. When you enter a trade based on a fractal, the peak (or trough) of that fractal is your line in the sand. If you go long on a bullish fractal, your stop loss should be placed just below the low of the middle candle. If the price breaks back through that level, the reversal has failed, and it’s time to exit the trade with a small, controlled loss.
- Stop Loss: Place it 2-3 pips beyond the fractal tip to account for spread and minor fluctuations.
- Take Profit: Aim for the next significant fractal level in the opposite direction, or use a 2:1 reward-to-risk ratio.
- Trailing Stops: As the price moves in your favor, you can move your stop loss to the next fractal that forms, ‘locking in’ profit as the trend develops.
Advanced Tips for Modern Traders
As we navigate the markets in 2026, the integration of fractals with other price action concepts like ‘Order Blocks’ or ‘Liquidity Sweeps’ has become a standard practice. Often, a fractal will form exactly where the big players are ‘clearing out’ retail stop losses. If you see a fractal form after a quick spike through a known resistance level, that is a high-conviction signal that the big money is actually positioning for a move in the opposite direction.
Furthermore, consider the ‘Fractal Breakout’. While we focus on reversals, a break above a previous up-fractal often signals a surge in momentum. This dual-use nature makes the indicator one of the most versatile tools in the MT4 library. It serves as both a warning sign of a slowing trend and a green light for a new breakout.
Filtering Out False Signals
The biggest challenge with fractals is ‘flat’ markets. When the price is moving sideways in a tight range, fractals will pop up everywhere, leading to a series of losing trades. To avoid this, only trade fractals when there is a clear expansion in volatility or when the price is reacting to a major psychological level (like round numbers or daily highs/lows). If the market looks like a heartbeat on a monitor—flat and jittery—keep your hands off the keyboard.
Final Thoughts on Price Action
The Reversal Fractals indicator for MT4 is a bridge between complex mathematical theories and simple visual trading. It doesn’t try to predict the future with 100% certainty; instead, it organizes the chaos of price movement into recognizable patterns. Success with this tool requires patience. You have to wait for the pattern to complete, wait for the confirmation, and have the discipline to ignore the signals that don’t fit your criteria.
Whether you are a day trader looking for quick turns on the 15-minute chart or a swing trader holding positions for days, fractals provide a consistent framework for understanding market structure. By respecting the highs and lows these patterns identify, you give yourself a significant edge in the ever-evolving landscape of the global currency markets.