The Hidden Geometry of the Forex Market
Have you ever looked at a raw price chart and felt like you were staring into a bowl of alphabet soup? The candles move up, they move down, and to the untrained eye, it all looks like random noise. But back in the late 20th century, legendary trader Bill Williams suggested that the market isn’t actually chaotic. Instead, it follows a specific, repeating geometric structure known as a fractal.
While most traders are familiar with the standard arrows that pop up on MetaTrader 4, the Fractal Levels Indicator takes this concept a step further. Instead of just pointing out a local high or low, it maps out the horizontal levels where the market has historically hit a brick wall. In 2026, where algorithmic trading dominates the landscape, understanding these human-psychology-driven levels is more important than ever.

What Exactly Are Fractal Levels?
To understand the indicator, we first have to understand the fractal itself. In the world of MT4, a fractal is a five-bar pattern where the middle candle has the highest high (an up fractal) or the lowest low (a down fractal) compared to the two candles on either side. It represents a temporary exhaustion of price—a moment where the bulls or bears simply ran out of steam.
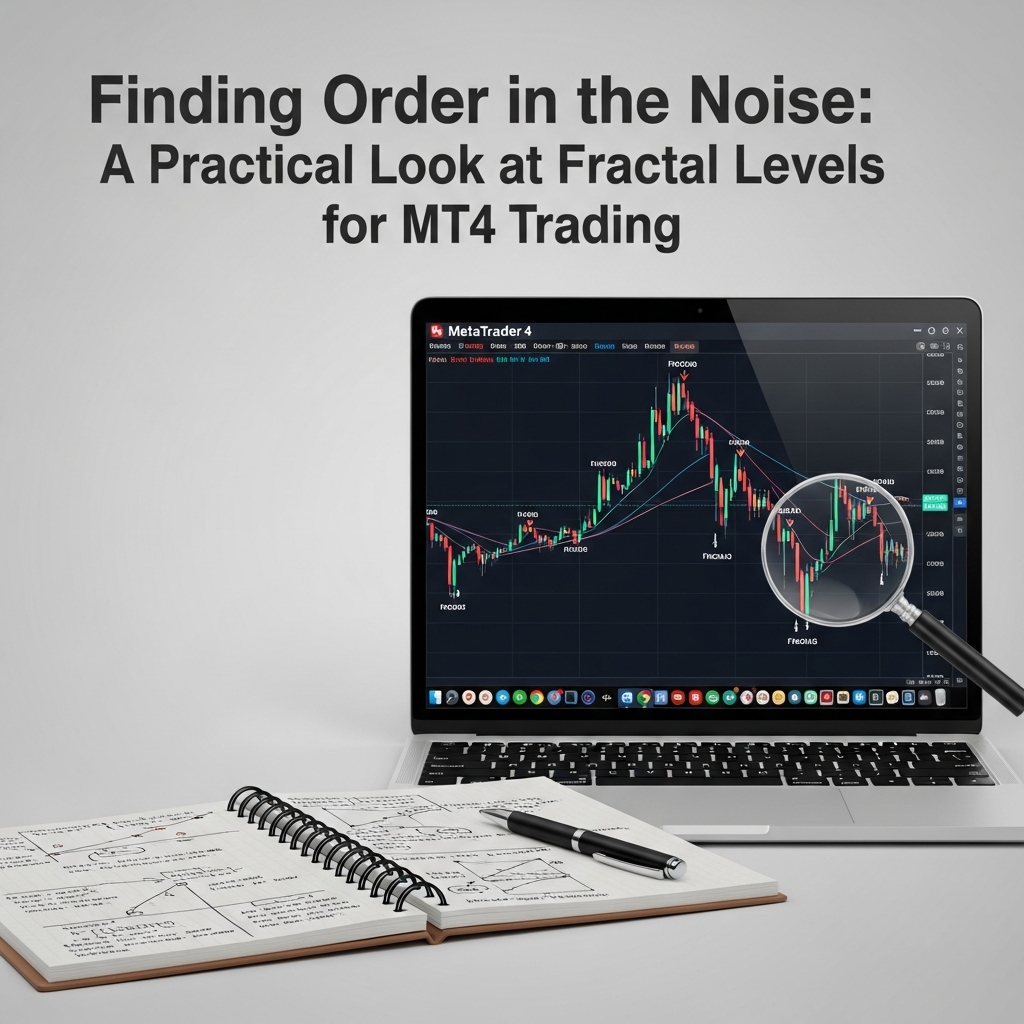
The Fractal Levels Indicator doesn’t just leave these as isolated points. It connects the dots. It identifies these swing points and projects them forward as horizontal lines of support and resistance. This transforms a messy chart into a clear map, showing you exactly where the “battle lines” have been drawn by institutional and retail traders alike.
Why Scale Matters
One of the most fascinating things about fractals is that they are self-similar across different timeframes. A fractal on a 5-minute chart looks remarkably like a fractal on a weekly chart. This is why the Fractal Levels Indicator is so versatile. Whether you are a scalper looking for a quick 10-pips or a swing trader holding positions for months, the underlying logic of market structure remains the same.
Core Features of the Indicator
Why should you bother adding this to your already crowded MT4 setup? Here are a few reasons why this tool remains a staple in professional toolkits:
- Automatic S/R Mapping: Manually drawing support and resistance lines is subjective. This indicator removes the guesswork by using mathematical rules to plot levels.
- Visual Clarity: By extending the levels across the screen, you can see how price reacts to the same level multiple times over several days or weeks.
- Customization: You can often adjust the “period” or the number of bars required to confirm a fractal, allowing you to filter out minor price fluctuations and focus on major turning points.
- Universal Application: It works on any asset—Forex pairs, Gold, Oil, or even Indices—because it is based on price action rather than specific fundamental data.
- Alert Systems: Many versions of this tool allow for push notifications or email alerts when price touches a significant fractal level.
A Realistic Strategy for Trading Fractal Levels
Having lines on a chart is one thing; knowing how to trade them is another. You shouldn’t just buy or sell every time the price hits a line. Instead, you need a disciplined approach. Here is a framework for using these levels effectively.
The Breakout and Retest Setup
One of the highest-probability ways to use this tool is the “break-and-retest” method. Instead of betting that a level will hold, wait for the market to prove its intent.
- Identify the Level: Look for a strong resistance level plotted by the indicator that has been touched at least twice.
- Wait for the Break: Wait for a candle to close decisively above that resistance level.
- The Retest: Often, price will dip back down to touch that old resistance (which should now act as support).
- Execution: Enter a long position when you see a bullish reversal candle (like a pin bar) right on that fractal level.
Managing Your Risk
The beauty of fractal levels is that they provide logical places for your stop-loss. If you are buying at a support level, your stop-loss should go just below the fractal candle that created the level. If the price breaks that point, the reason for your trade is no longer valid, and it’s time to get out. No ego, no hovering over the “close” button—just math.
The Reality Check: Potential Pitfalls
Let’s be honest: no indicator is a crystal ball. If it were, we’d all be trading from our private islands. The Fractal Levels Indicator has a few quirks you need to be aware of.
First, fractals are lagging indicators. By definition, a fractal requires two candles to close to the right of the peak. This means the signal only appears two candles after the actual high or low has occurred. If you are trading on a 1-hour chart, you are getting the signal 2 hours late.
Second, in a trending market, resistance levels are meant to be broken. If you try to sell every up-fractal in a strong bull market, you are going to get run over. Always look at the bigger picture. Use the fractal levels on the H4 chart to find your zones, but use the M15 or H1 chart to find your actual entry triggers.
Best Practices for Success
To really make the most of this tool, consider these three rules of thumb:
- The Power of Confluence: Never use fractal levels in a vacuum. If a fractal level aligns with a psychological round number (like 1.1000) or a Fibonacci retracement level, the probability of a bounce increases significantly.
- Demo First: This sounds like a cliché, but it’s vital. Every currency pair has its own “personality.” Some respect fractal levels perfectly, while others tend to overshoot them. Spend a few weeks on a demo account to see how your favorite pairs behave.
- Clean Your Charts: Don’t overlay ten different indicators. If you use fractal levels, maybe pair them with a single moving average to identify the trend. Too much data leads to analysis paralysis.
The Verdict
The Fractal Levels Indicator for MetaTrader 4 is a bridge between complex mathematical theory and practical, everyday trading. It takes the abstract concept of market self-similarity and turns it into actionable lines on a screen. By helping you identify where the market is likely to pause or reverse, it gives you a significant edge over traders who are just guessing.
Whether you are trying to find better exit points for your trades or looking for a more objective way to define support and resistance, this tool deserves a spot in your MT4 navigator window. It won’t do the work for you, but it will certainly make the market’s “noise” a lot easier to tune out.