The Geometry of Price: What Fractals Really Are
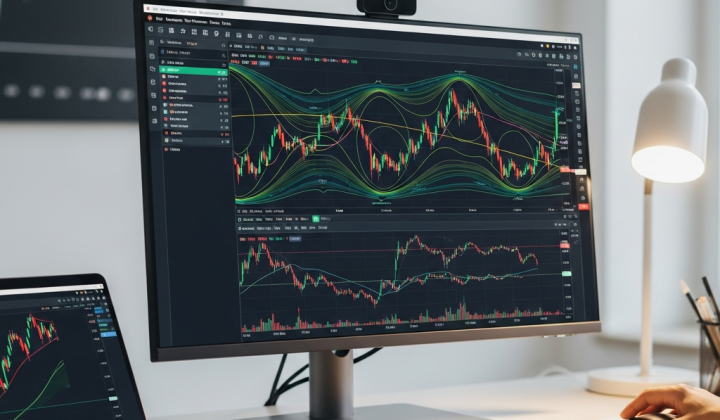
If you have ever looked closely at a fern leaf or the jagged edges of a coastline, you have witnessed a fractal. These are complex patterns that look similar regardless of how much you zoom in or out. In the late 20th century, legendary trader Bill Williams realized that financial markets operate under the same laws of chaos and self-similarity. He developed the Fractals indicator to help traders identify the underlying structure of price action that often remains invisible to the untrained eye.
In 2026, despite the dominance of high-frequency algorithms and AI-driven trading bots, the core psychology of the market hasn’t changed. Humans and machines still react to support, resistance, and exhaustion. The Fractals indicator on MetaTrader 4 remains a staple tool because it strips away the noise and highlights the pivotal points where a trend is likely to buckle or break.
The Anatomy of a Trading Fractal
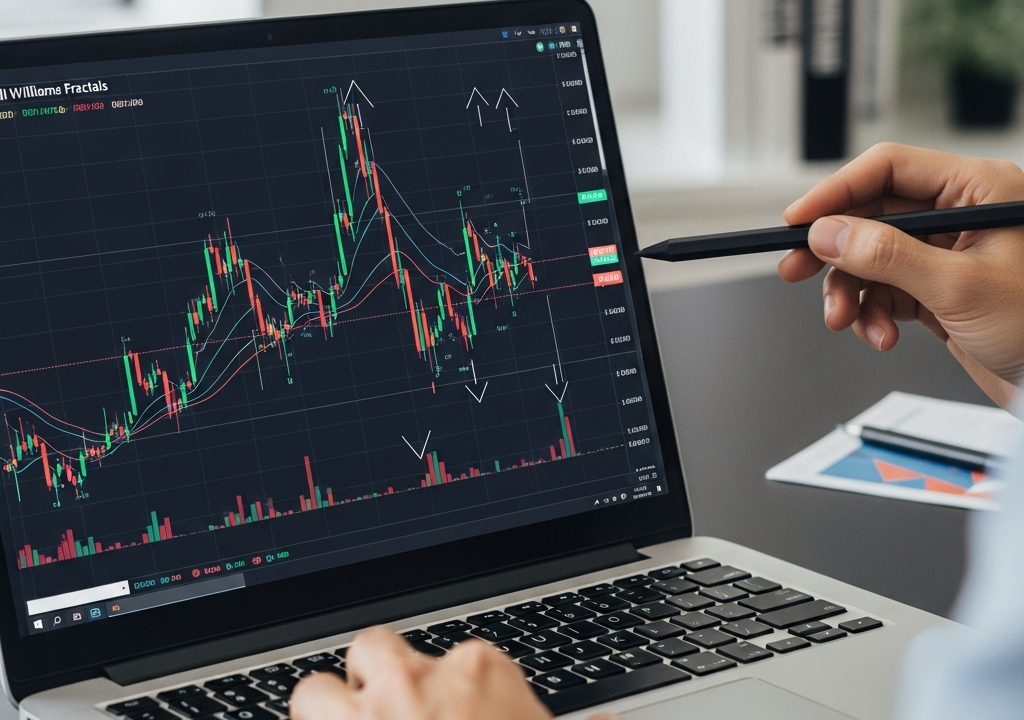
A fractal on your MT4 chart isn’t just a random arrow; it is a specific five-bar sequence. To understand how to trade them, you first need to understand how they are built. There are two primary types: the Fractal Up (Bearish) and the Fractal Down (Bullish).
The Fractal Up (Bearish Reversal)
A Fractal Up occurs when there is a high point surrounded by two lower highs on each side. Think of it like a mountain peak. The middle candle is the highest point, preceded by two candles with lower peaks and followed by two candles with lower peaks. When this pattern completes, MT4 places an arrow above the middle candle. This signals that the market tried to push higher but failed, indicating a potential downward turn or a strong level of resistance.
The Fractal Down (Bullish Reversal)
Conversely, a Fractal Down is like a valley. It consists of a low point with two higher lows on either side. The middle candle is the lowest, and the two candles before and after it fail to reach that same depth. An arrow appears below this middle candle, suggesting that the bears have exhausted their momentum and the bulls might be ready to take over.

Why MT4 Traders Still Rely on This Tool in 2026
You might wonder why a tool developed decades ago is still relevant in the modern era of 2026. The answer lies in its simplicity and its mathematical grounding in chaos theory. Fractals are not predictive in the traditional sense; they are reactive. They confirm that a specific price level has been tested and held.
One of the biggest advantages of using fractals on MT4 is their ability to define clear exit and entry points. In a world where market volatility can be erratic, having a visual marker for a “stop-run” or a “swing high” is invaluable. They act as natural milestones on a chart, helping you navigate through the fog of daily price fluctuations.
Step-by-Step: Implementing Fractal Strategies
Simply putting the indicator on your chart and trading every arrow you see is a fast track to a shrinking account balance. Fractals are lagging indicators because the pattern requires two subsequent candles to close before the arrow appears. Therefore, you must use them strategically.
Strategy 1: The Fractal Breakout
This is the most common way to use the indicator. Instead of trying to catch the exact reversal, you wait for the market to prove its direction. If a Fractal Up is formed, that high point becomes a significant resistance level. If price later breaks above that fractal high, it signals a strong bullish continuation. Many traders place “Buy Stop” orders a few pips above the most recent Fractal Up to catch these momentum shifts.
Strategy 2: Dynamic Support and Resistance
In a trending market, fractals often cluster around specific price zones. By looking back at the last three or four fractals, you can draw horizontal zones that represent “real” support and resistance. Unlike standard pivot points which are calculated based on previous day math, fractal zones are based on actual price rejection. In 2026, these zones are particularly effective for setting stop-loss orders just behind the most recent fractal low or high.

The Power of Confluence: Fractals and the Alligator
Bill Williams didn’t design the Fractals indicator to work in isolation. He intended it to be used alongside his other creation: The Alligator indicator. The Alligator consists of three smoothed moving averages (the Jaw, Teeth, and Lips). The golden rule in the Williams system is to only take fractal signals that occur outside the Alligator’s mouth.
- Buying: Look for a Fractal Up that forms above the Alligator’s Teeth (the red line).
- Selling: Look for a Fractal Down that forms below the Alligator’s Teeth.
When the Alligator is “sleeping” (the lines are intertwined), you ignore all fractals. This filter prevents you from getting chopped up in sideways markets, which is where most fractal traders lose money. By waiting for the Alligator to “wake up” and hunt, you ensure you are trading with the trend.
Avoiding the Traps: The Lag Factor and False Signals
The most important thing to remember is that a fractal is not “confirmed” until the two candles to the right of the signal candle have closed. If you see an arrow appearing while a candle is still moving, do not jump the gun. That arrow can disappear if the current price action invalidates the 5-bar sequence. This is the “lag” that many beginners complain about, but it is actually a safety mechanism.
Furthermore, fractals on lower timeframes (like the 1-minute or 5-minute charts) are notoriously unreliable. They appear constantly and often represent minor ripples rather than significant shifts. For the best results in 2026’s fast-paced environment, focus on the 4-hour (H4) and Daily (D1) charts. These fractals represent significant institutional shifts and are far more likely to hold up under pressure.
Multi-Timeframe Analysis with Fractals
To really gain an edge, use fractals across two different timeframes. For example, look at the Daily chart to determine the overall trend. If the Daily chart is making higher Fractal Ups and higher Fractal Downs, you are in an uptrend. Then, drop down to the 1-hour chart and only take “Buy” signals at the Fractal Down points. This “top-down” approach ensures you aren’t fighting the larger market tide while using the precision of the lower timeframe for your entry.
Final Thoughts on Geometric Trading
The Fractals indicator for MT4 is a bridge between the chaotic movements of the market and the structured needs of a trader. It doesn’t promise a 100% win rate—no tool does—but it provides a systematic way to identify where the market is catching its breath. By treating fractals as markers of exhaustion and breakout points rather than magic arrows, you can build a robust trading plan that survives the tests of time.
Success with fractals requires patience. It requires waiting for the pattern to complete and confirming the move with other tools like volume or trend filters. In the end, trading is about recognizing patterns that repeat over and over again. Fractals are simply the market’s way of showing you its thumbprint.