The Quest for Order in a Chaotic Market
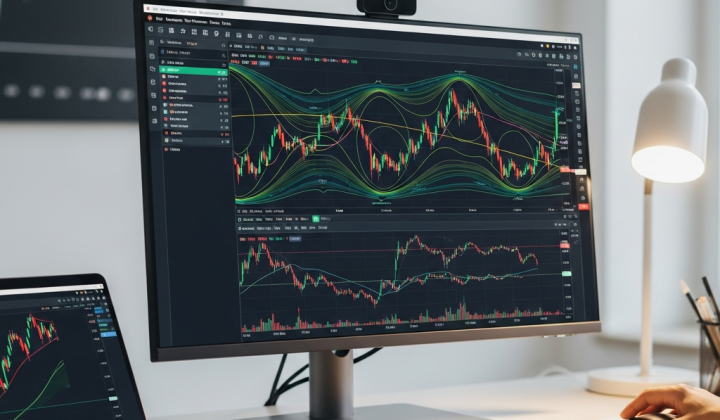
To the untrained eye, a forex chart looks like a random mess of jagged lines and jumping candles. Especially in 2026, where algorithmic high-frequency trading can cause sudden bursts of volatility, finding a sense of direction can feel like trying to read tea leaves in a hurricane. However, seasoned traders know that the market isn’t entirely random. It has a pulse, a rhythm, and most importantly, a recurring geometry. This is where the concept of fractals comes into play.
Fractals are not just a mathematical curiosity found in nature or computer-generated art; they are the DNA of price movement. Originally popularized in the trading world by the legendary Bill Williams, fractals represent a basic structure of trend changes. The Fractals Alert Indicator for MT4 takes this classic concept and modernizes it, providing traders with real-time notifications when these specific geometric shapes form on their screens. Instead of staring at the screen for hours waiting for a pattern to complete, this tool does the heavy lifting for you.
Understanding the Logic Behind the Fractal Pattern
Before we look at the indicator itself, we need to understand what it is actually hunting for. In the world of technical analysis, a fractal is a five-candle sequence. For a bullish fractal to form, you need a low point that is preceded by two higher lows and followed by two higher lows. Conversely, a bearish fractal requires a high point flanked by two lower highs on both sides.
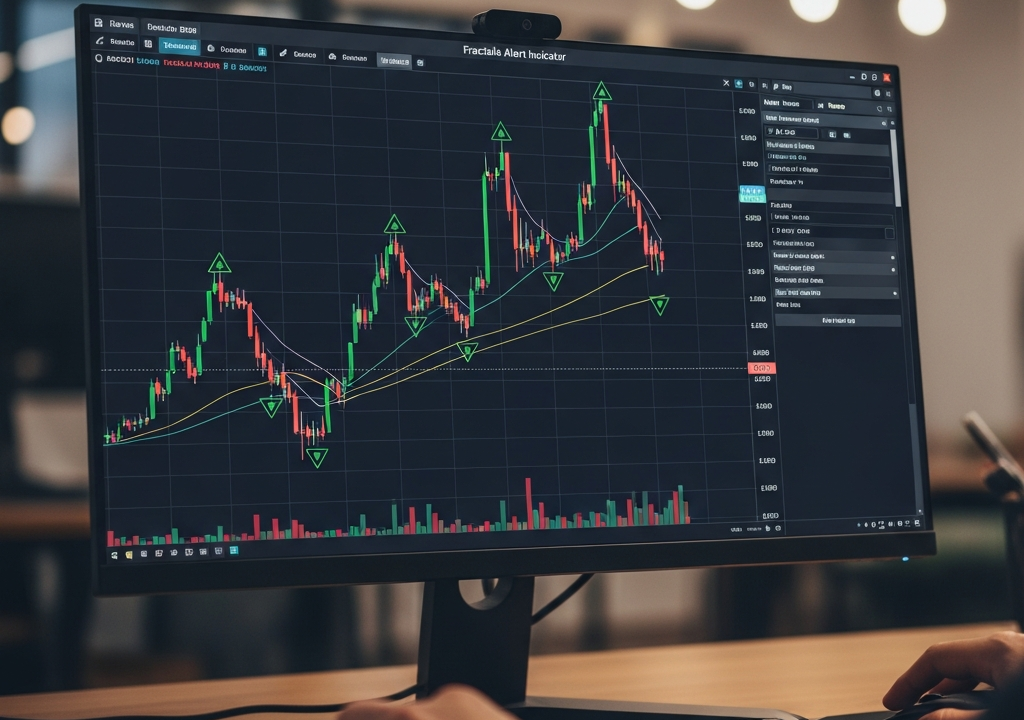
This structure is significant because it represents a temporary exhaustion of momentum. When the market tries to push price lower but fails to break that middle candle’s low for two consecutive sessions, it suggests that the bears are losing their grip. The Fractals Alert Indicator automates the recognition of these sequences, placing a visual marker on the chart the moment the fifth candle closes and confirms the pattern.

Key Features of the Fractals Alert Indicator
While the standard fractal indicator included in MetaTrader 4 is functional, it is often criticized for being too subtle. Traders often miss the small arrows until the move has already passed them by. The Fractals Alert Indicator improves on the original in several ways:
- High-Visibility Markers: Instead of tiny arrows, this indicator uses distinct blue and red diamond symbols. Blue diamonds appear below bullish fractals, while red diamonds sit above bearish ones.
- Real-Time Notification System: The “Alert” part of its name is its strongest selling point. It can trigger a sound alert, a pop-up window, or even an email notification the second a fractal is confirmed.
- On-Screen Dashboard: Many versions of this indicator include a toggleable trade info display. This shows your current account balance and potential trade parameters, allowing you to stay focused on the chart without switching back to the terminal window.
- Customizable Parameters: You can choose which alerts to receive and how they are delivered, ensuring that the tool fits your specific workflow rather than forcing you to change how you trade.
The Strategy: How to Trade Fractal Signals Effectively
Using the Fractals Alert Indicator isn’t just about clicking ‘buy’ or ‘sell’ every time a diamond pops up. Like any technical tool, it requires a strategy to filter out the ‘noise’ from the ‘signal.’ Because a fractal is a lagging indicator—it needs two candles to close *after* the peak or trough—it is best used as a confirmation of a larger thesis.
The Bullish Setup (Buy Entry)
When you are looking for a long position, you want to see the market in a general uptrend or at a significant support level. The signal occurs when the indicator plots a blue diamond below a candle. However, the savvy trader doesn’t just jump in. A more robust approach is to wait for the price to break above the high of the middle candle of the fractal pattern. This acts as a secondary confirmation that momentum has truly shifted.
Your stop loss should ideally be placed just below the low of the fractal pattern. This gives the trade room to breathe while ensuring you exit if the support level is invalidated.
The Bearish Setup (Sell Entry)
For short positions, look for a red diamond to appear above a price peak. This indicates that the market’s attempt to move higher has stalled. Again, the highest probability trades occur when this happens at a resistance zone or a downward-sloping trendline. Once the red diamond is confirmed, you can look to enter as price breaks below the fractal’s low point. Your stop loss would naturally sit above the red diamond, protecting your capital against a sudden spike in price.

Navigating the Lag: A Realistic Perspective
One of the most common complaints about fractals is that they “lag.” Since the pattern requires five candles, the signal is only confirmed on the close of the fifth candle. By this time, the price may have already moved significantly away from the turning point. In the fast-paced markets of 2026, two candles can represent a lot of pips.
To combat this, professional traders often use the Fractals Alert Indicator on higher timeframes like the H4 or Daily. On these charts, the two-candle lag is less significant compared to the overall trend move. Furthermore, using fractals in conjunction with a momentum oscillator like the RSI or MACD can help you anticipate which fractals are likely to lead to a major reversal and which are just minor retracements in a larger trend.
The Power of Confluence
No indicator is a crystal ball. The Fractals Alert Indicator becomes truly powerful when used as part of a “confluence” strategy. This means you only take a fractal signal if it aligns with other technical factors. For example:
- Trendlines: Does the bullish fractal appear right as price touches a long-term ascending trendline?
- Moving Averages: Is the bearish fractal forming as price rejects the 200-period EMA?
- Fibonacci Levels: Does the fractal align with a 61.8% retracement level?
When multiple signals point in the same direction, your win rate naturally increases. The indicator serves as the final “trigger” for an entry you were already considering based on the broader market context.
Practical Tips for MT4 Users
To get the most out of this tool, consider the following technical adjustments. First, ensure your MT4 platform’s “Max bars in chart” setting is high enough to allow the indicator to calculate historical fractals; this helps you see how the indicator performed during previous market conditions. Second, don’t overcomplicate your screen. If you use too many indicators alongside the Fractals Alert, you may suffer from ‘analysis paralysis.’ Keep it clean: one trend indicator, one oscillator, and your fractal diamonds are usually enough to maintain a clear perspective.
Final Considerations on Fractal Trading
The beauty of the Fractals Alert Indicator for MT4 lies in its simplicity. It takes the complex, fractal nature of the markets and boils it down to a simple visual cue. While it doesn’t eliminate the need for sound risk management or a deep understanding of market structure, it significantly reduces the cognitive load on the trader. By highlighting the psychological turning points where buyers and sellers lose their momentum, it provides a roadmap through the chaos.
Remember that trading is a game of probabilities. Some fractal signals will fail, and some will lead to massive trend reversals. The key is to remain disciplined, use the alerts as a guide rather than an absolute command, and always protect your downside. In the evolving landscape of 2026, having a tool that helps you see the underlying geometry of the market is not just a luxury—it’s a necessity for anyone looking to find consistency in their trading journey.