The Chaos of the Charts and the Search for Order
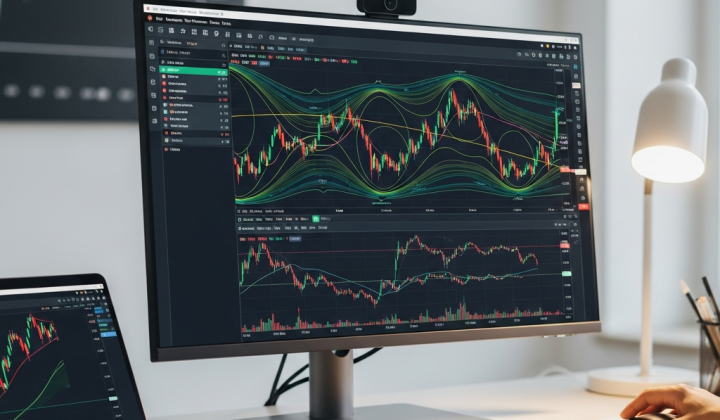
If you have ever spent a late night staring at a MetaTrader 4 chart, you know the feeling. The candles move, the price ticks up and down, and everything looks like a random mess of noise. To the untrained eye, there is no rhyme or reason. But seasoned traders know that beneath that surface-level chaos, the market has a skeletal structure. The challenge has always been seeing it clearly without cluttering your screen with a hundred different trendlines.
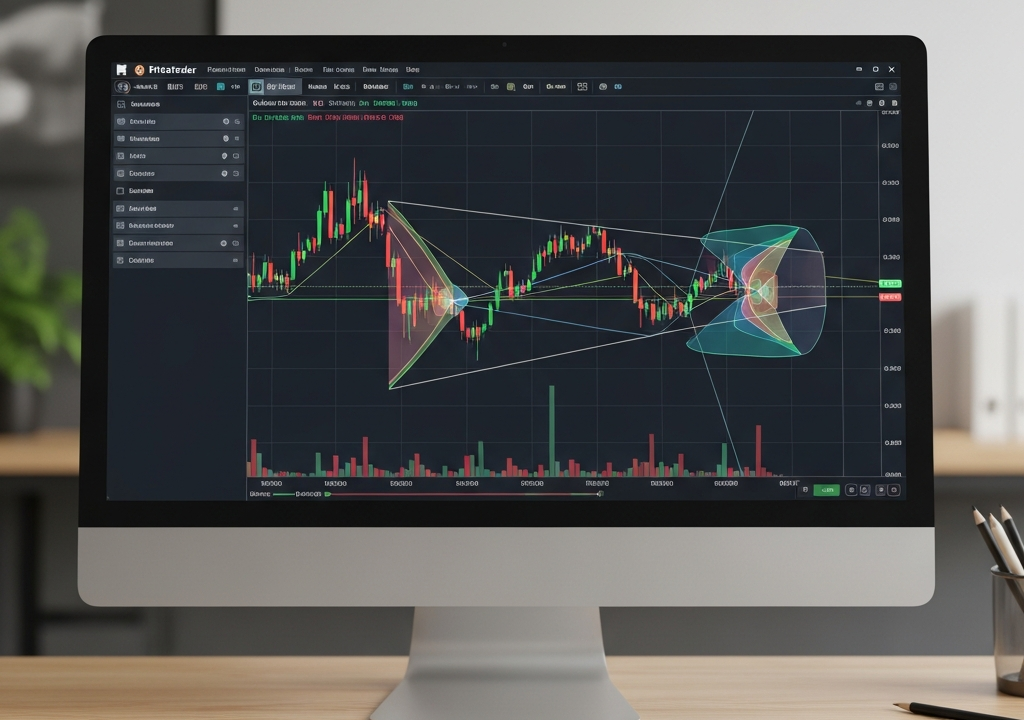
This is where the concept of fractals comes into play. Originally brought into the mainstream trading world by the legendary Bill Williams, fractals are mathematical patterns that repeat at every scale. In the context of trading, they represent the turning points where the market’s momentum shifts. By using a Fractal Support and Resistance indicator, we stop guessing where a floor or ceiling might be and start letting the market’s own geometry tell us the story.
What Exactly Is a Fractal in Trading?
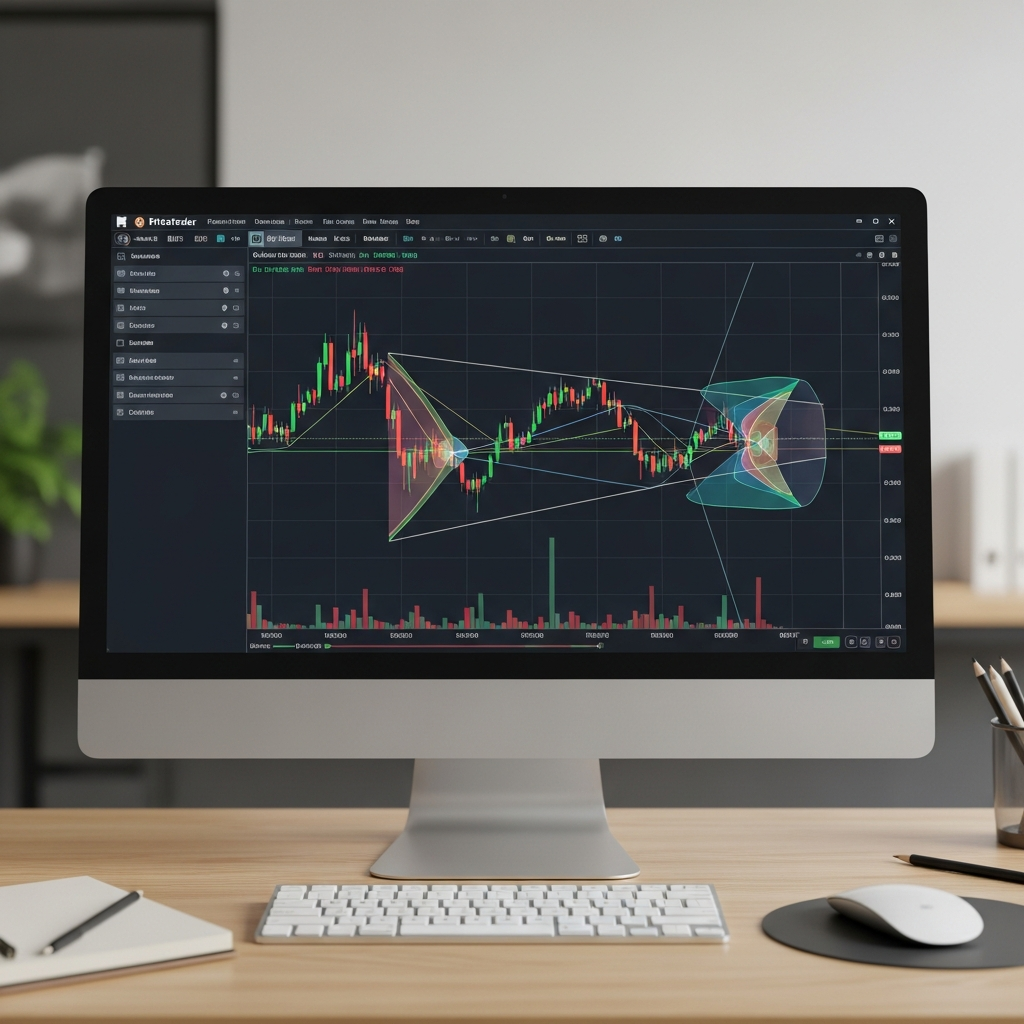
Before we get into the nuts and bolts of the indicator, we need to strip away the complex math and look at what a fractal actually represents on your chart. In the simplest terms, a fractal is a five-bar pattern. For a ‘Up’ fractal (indicating a peak), you need a high candle that is flanked by two lower highs on each side. Conversely, a ‘Down’ fractal (indicating a trough) is a low candle flanked by two higher lows on each side.
Why five bars? Because it represents a completed cycle of sentiment. Price tried to push higher, reached a limit, and then retreated enough to confirm that the peak was significant. When you see these patterns over and over again, you begin to realize that they aren’t just random arrows on a screen; they are the footprints of institutional movement and retail exhaustion.
The Problem with Traditional Support and Resistance
Most beginners are taught to draw horizontal lines across the peaks and valleys they see. The problem? It is incredibly subjective. One trader might draw a line at the candle wick, while another draws it at the candle body. Soon, your chart looks like a spiderweb of lines, and you are paralyzed by “analysis paralysis.”
The Fractal Support and Resistance indicator for MT4 removes that subjectivity. It automatically identifies these five-bar patterns and projects horizontal levels from them. This creates a dynamic map of the market. Instead of a static line you drew three days ago, you get levels that evolve as the market structure changes. It provides a cleaner, more objective way to view price action.
How the Indicator Transforms Your Trading Workflow
Using this tool isn’t about finding a “magic pill” that wins every trade. Instead, it’s about improving your decision-making process. Here is how it actually changes the way you interact with the MT4 platform:
- Automated Level Identification: You no longer need to manually scan multiple timeframes to find where the price stalled. The indicator does the heavy lifting, allowing you to focus on the “how” and “why” of the trade.
- Visual Clarity: By filtering out the noise and only highlighting significant fractals, your chart becomes a tool for navigation rather than a source of confusion.
- Historical Context: You can see how often a specific fractal level has been tested in the past. If the indicator shows a level that has rejected price three or four times, you know you are looking at a high-conviction zone.

Practical Strategies for the Fractal S&R Indicator
Having the indicator on your chart is only half the battle. You need a plan. Here are three ways to integrate these fractal levels into a cohesive trading strategy.
1. The Breakout Confirmation
One of the most effective ways to trade fractals is to look for a breakout. When price has established a fractal high, it represents a ceiling of resistance. If a candle closes decisively above that fractal level, it signals that the bulls have gathered enough momentum to break the previous cycle. Many traders use this as an entry signal, placing a buy order a few pips above the fractal high with a stop loss just below the most recent fractal low.
2. The Dynamic Stop-Loss Technique
If you struggle with where to place your stop loss, fractals are your best friend. Since a fractal represents a point where the market reversed, it is a natural area of protection. In a long trade, you can trail your stop loss behind the most recent ‘Down’ fractals. This allows you to stay in a trend as long as the market structure remains intact, only getting stopped out when the market truly shifts direction.
3. Confluence with Other Tools
Fractals work best when they aren’t working alone. Imagine you are looking at a fractal resistance level. If your RSI (Relative Strength Index) is also showing an overbought condition, the probability of that fractal level holding firm increases significantly. Combining geometric levels with momentum oscillators creates a powerful “one-two punch” for identifying reversals.
Common Pitfalls to Avoid
No tool is perfect, and the Fractal S&R indicator is no exception. The most common mistake traders make is using it on very low timeframes, like the 1-minute or 5-minute charts, without considering the bigger picture. On these fast timeframes, fractals are created constantly, leading to a lot of “fake” signals or noise.
Another thing to keep in mind is that fractals are lagging by nature. Because you need two bars to the right of the peak to confirm the pattern, the fractal arrow won’t appear until the fifth bar is closed. You aren’t catching the absolute top or bottom the second it happens; you are catching the confirmation that a top or bottom has formed. For a disciplined trader, this is a feature, not a bug, as it prevents jumping into a trade too early.
Advanced Perspective: Fractals and Market Psychology
Why do these levels actually work? It comes down to human psychology. When the market creates a peak (an up fractal), every trader who bought at that peak is now in a losing position if the price drops. When the price eventually returns to that level, those traders often look to “break even” and sell their positions. This influx of selling pressure creates the resistance we see on the chart. By tracking these fractals, you are essentially tracking the collective memory of the market participants.
Final Thoughts on the Fractal Approach
The Fractal Support and Resistance indicator for MetaTrader 4 is more than just a visual aid; it is a bridge between the chaotic movement of price and the structured logic of geometry. It forces you to look at the market in terms of completed cycles rather than individual candles. By automating the identification of these key zones, you free up your mental energy to focus on risk management and emotional discipline—the two things that actually determine long-term success in the forex market.
Whether you are a scalper looking for quick targets or a swing trader trying to catch a weekly trend, understanding where the market has historically turned is vital. Let the fractals show you where the floors and ceilings are built, and you might find that the charts aren’t so chaotic after all.