
The Search for Structure in a Chaotic Market
If you have spent more than five minutes looking at a live currency chart, you know the feeling of pure overwhelm. Prices tick up and down with a frequency that feels almost erratic. To the untrained eye, the forex market is a sea of noise. But seasoned traders know that beneath that surface-level chaos, there are recurring geometric patterns that repeat across every timeframe. This is where the concept of fractals comes into play.
Originally popularized by Bill Williams, fractals are a cornerstone of technical analysis. They represent a basic unit of price movement: a reversal. While the standard fractal indicators built into most platforms do a decent job, they often miss the subtle shifts that occur within smaller price windows. That is where the Fine Fractals Indicator for MT4 steps in. It is designed to be more sensitive, more responsive, and ultimately more useful for the modern trader who needs to see the micro-structures of the market.
What Exactly Is the Fine Fractals Indicator?
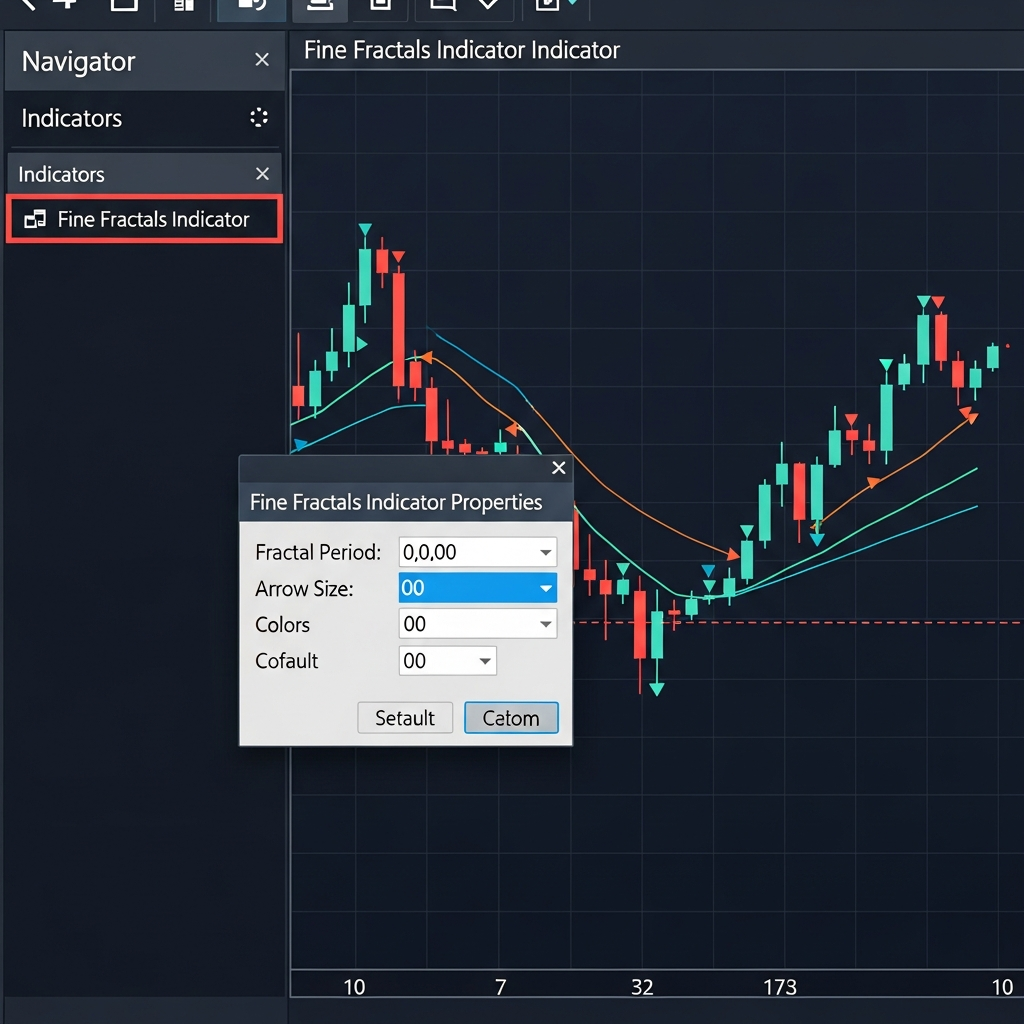
At its core, the Fine Fractals Indicator is a visual mapping tool. It scans your charts and identifies specific price formations where the market has attempted to push in one direction, failed, and then reversed. Unlike the standard fractal tool that typically requires a five-bar sequence to confirm a high or low, the “Fine” version of this indicator can be tuned to pick up much smaller, more immediate pivots.
The indicator uses a simple visual language to communicate with you:
- Green Dotted Circles: These appear at the bottom of a candle, signaling a bullish fractal. This indicates that the market has found a temporary floor.
- Red Dotted Circles: These appear at the top of a candle, signaling a bearish fractal. This suggests the market has hit a temporary ceiling.
The beauty of this tool lies in its automation. Instead of manually hunting for these shapes, the indicator plots them in real-time, allowing you to focus on the bigger picture: the strategy.
The “Fine” Difference: Why Sensitivity Matters
Standard fractal indicators are often too “slow” for day traders or scalpers. By the time a five-bar fractal is confirmed, the move might already be halfway over. The Fine Fractals Indicator introduces a level of granularity that is often missing. It looks for multi-candle patterns where the middle candle has a higher high or a lower low than its immediate neighbors.
By enabling the “Fine” option in the settings, the algorithm narrows its focus. It can identify patterns spanning as few as three candles. This might sound like a small change, but in a fast-moving market, those two extra candles of lead time can be the difference between catching a trend at the start or chasing it near the end.
Customization and Alerts
In the 2026 trading environment, we are all fighting for attention. You cannot stare at twenty charts simultaneously. The Fine Fractals Indicator includes a “New F Alert” feature. This is a game-changer for multi-pair traders. Rather than hovering over one chart, you can set the indicator to ping you the moment a new fractal forms, ensuring you never miss a potential reversal point on your watchlist.
How to Read the Market Through Fractals
Fractals are not just “buy” or “sell” arrows. If you trade them that way, you will likely get caught in the very noise you are trying to avoid. Instead, think of fractals as the building blocks of market structure. Here is how to use them effectively.
1. Identifying the Trend DNA
A trend is not just a line on a chart; it is a series of successful and failed attempts to move price. In a healthy uptrend, you should see a sequence of higher fractal highs and higher fractal lows. If the green circles (the lows) are consistently forming higher than the previous ones, the bulls are in control. When that pattern breaks—when a new fractal low forms below a previous one—you have your first warning sign that the trend might be exhausting.
2. Precision Stop Loss Placement
One of the hardest parts of trading is knowing where to put your protective stop. Many traders use arbitrary numbers, which often leads to being “stopped out” by a tiny bit of volatility before the market goes in their direction. Fractals provide a natural, objective level for stops. A bullish fractal low is a level where the market previously found support. Placing your stop just below that green circle gives your trade room to breathe while still protecting you if the support level actually fails.
Strategic Setups: Trading with the Fine Fractals
To get the most out of this indicator, you should combine it with established support and resistance levels. A fractal appearing in the middle of a range is less significant than one appearing at a major price level.
The Bullish Reversal Entry
Imagine the price is falling toward a major support zone you identified on a higher timeframe (like the H4 or Daily). You are looking for a reason to go long, but you don’t want to catch a falling knife. You wait for the price to hit the zone, and then you watch the Fine Fractals Indicator on a lower timeframe (like the M15 or M5).
- Step 1: Price enters the support zone.
- Step 2: Wait for a green dotted circle to appear, signifying a bullish fractal.
- Step 3: Enter the buy trade once the fractal candle closes.
- Step 4: Place your stop loss just below that fractal low.
The Bearish Reversal Entry
Conversely, if price is rallying into a heavy resistance area, you are looking for signs that the buyers are giving up.
- Step 1: Price touches the resistance area.
- Step 2: Wait for the indicator to plot a red dotted circle at a candle high.
- Step 3: Execute a sell order.
- Step 4: Place your stop loss slightly above the red circle to protect against a breakout.
The Importance of Context
It is worth repeating: fractals are not a magic bullet. If the market is in a tight, sideways chop, the indicator will plot circles everywhere. This is because, in a range, the market is constantly reversing in small increments. During these times, the signals can be unreliable if used in isolation.
The secret to success with the Fine Fractals Indicator is filtering. Use it as a confirmation tool. If you already have a reason to be bullish—perhaps because of a moving average crossover or a fundamental news event—the appearance of a bullish fractal acts as the “trigger” to pull the trade. It provides the timing that the bigger-picture analysis lacks.
Final Thoughts for the Modern Trader
Trading in 2026 requires a blend of automation and human intuition. The Fine Fractals Indicator for MT4 removes the guesswork of identifying price pivots, giving you a cleaner, more objective view of price action. By focusing on the “Fine” details of these patterns, you can gain a slight edge in timing—and in the world of forex, a slight edge is often all you need.
Whether you use it to refine your entries, manage your risk with tighter stop losses, or simply to better understand the rhythm of the trend, this tool is a versatile addition to any MT4 setup. Just remember to keep the broader market context in mind, and let the fractals show you where the floor and ceiling are truly being built.