Getting Past the Noise: A Better Way to Read the Markets
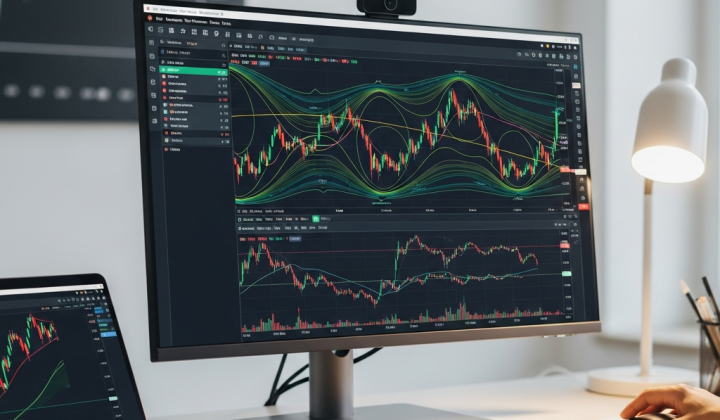
Trading in 2026 hasn’t gotten any easier. Even with the rise of AI-driven bots and high-frequency algorithms, the average retail trader still struggles with the same old problem: market noise. You look at a chart, and it’s a mess of wicks, gaps, and indecisive candles. It’s easy to feel like you’re trying to read tea leaves in a hurricane.
This is where technical indicators like the ZigZag and Fractals come into play. While many traders try to find the ‘holy grail’ in complex mathematical formulas, the most successful often go back to the basics of price geometry. By combining the ZigZag—a tool designed to filter out the fluff—with Fractals—a tool designed to pinpoint turning points—you get a much clearer picture of what the market is actually doing.
Let’s take a deep look at how the ZigZag Fractals indicator for MetaTrader 4 (MT4) works and why it might be the missing piece in your trading toolkit.
What Exactly Is the ZigZag Indicator?
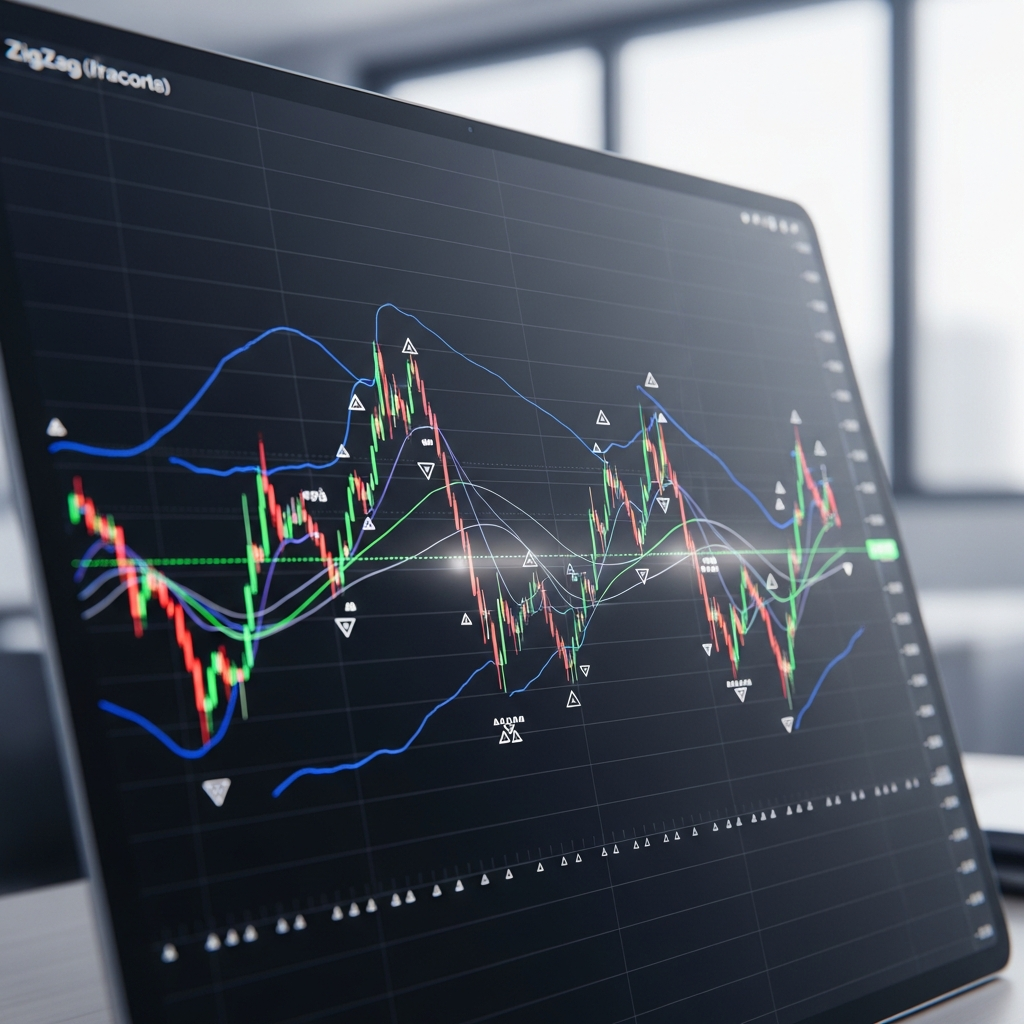
If you’ve ever felt overwhelmed by every tiny price fluctuation, the ZigZag is your best friend. It doesn’t predict the future; instead, it looks at the past and draws straight lines connecting significant highs and lows. It ignores price movements that don’t meet a specific percentage or pip threshold.
Think of it as a filter. If the market moves up 10 pips, down 5, and then up another 10, the ZigZag might just draw one single line going up, provided those smaller retracements didn’t hit your settings’ requirements. This helps you identify the actual trend waves rather than getting spooked by every minor pullback.
The Three Pillars of ZigZag Settings
When you load this onto your MT4 platform, you’ll usually see three main settings:
- Depth: This refers to the minimum number of bars without a second maximum/minimum. It determines how ‘sensitive’ the indicator is.
- Deviation: The percentage or number of pips required for the indicator to change its direction.
- Backstep: The minimum number of bars between highs and lows.
Adjusting these allows you to tailor the indicator to different timeframes. A higher depth is great for swing trading on the H4 or Daily charts, while a lower depth might be necessary for those trying to scalp the M15.
The Fractal Factor: Bill Williams’ Gift to Traders
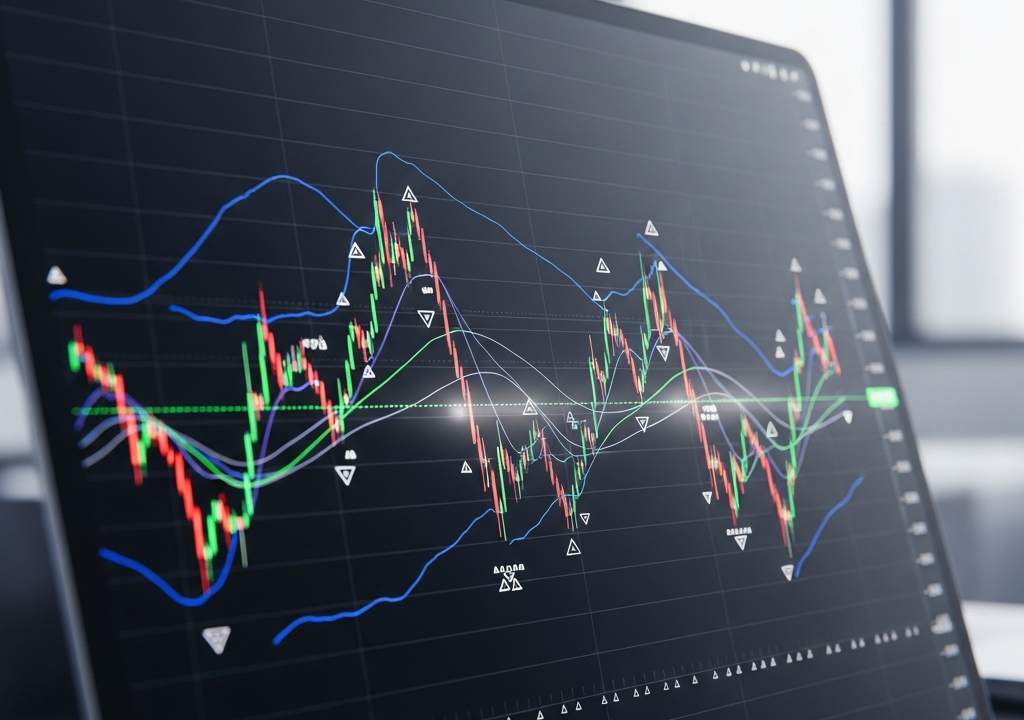
While the ZigZag handles the big picture, Fractals focus on the immediate pivot. Developed by the legendary trader Bill Williams, a Fractal is a simple five-bar pattern. A bullish fractal occurs when there is a low point surrounded by two higher lows on each side. Conversely, a bearish fractal is a high point surrounded by two lower highs.
Fractals are essentially the market saying, “I tried to go further this way, but I couldn’t.” They represent a temporary exhaustion of momentum. When they appear, they mark a potential reversal or the start of a new trend wave.
The Power of the Duo: Why Use Them Together?
You might wonder why you need both. The truth is, Fractals can be a bit ‘noisy’ on their own. On a volatile day, you might see dozens of fractals popping up on your chart, many of which lead nowhere. The ZigZag acts as the quality control. When a Fractal aligns with a ZigZag point, the signal carries significantly more weight.
When the ZigZag forms a new ‘leg’ and a Fractal appears right at the tip of that leg, you have a high-probability zone. It’s a confirmation that the price action structure is shifting. This combination allows you to see the ‘skeleton’ of the market without being distracted by the ‘flesh’ of minor price wiggles.
Practical Strategies Using ZigZag Fractals
So, how do you actually make money with this? It’s not just about watching lines appear on a screen; it’s about understanding the story they tell.
1. Identifying Support and Resistance Zones
Instead of drawing lines at every single candle wick, use the ZigZag Fractal points. These are the areas where the market actually turned. If you see multiple ZigZag peaks at a similar price level, you’ve found a major resistance zone. These points are much more reliable than random horizontal lines because they represent verified price exhaustion.
2. The Breakout Confirmation
Many traders lose money on ‘fakeouts.’ A common way to use this indicator is to wait for the price to break above a previous ZigZag high or below a previous ZigZag low. If a Fractal is sitting at that point, it acts as a visual anchor. A clean break past a Fractal-marked ZigZag level often signals a strong continuation of the trend.
3. Smarter Stop-Loss Placement
One of the hardest parts of trading is knowing where to put your stop-loss. If you go long, a common technique is to place your stop-loss just below the most recent bullish Fractal that coincides with a ZigZag low. This ensures your stop is placed behind a structural pivot point, making it less likely to be hit by random market noise.
The Elephant in the Room: Repainting
We need to talk about the ‘R’ word: Repainting. Most ZigZag-based indicators repaint. This means that as the price continues to make a new high, the ZigZag line will move with it. The line isn’t ‘set in stone’ until the price moves far enough in the opposite direction to satisfy the ‘Deviation’ setting.
This is why you should never trade a ZigZag signal the very moment it appears. You need to wait for confirmation. This is where the Fractals and other price action tools come in. Use the ZigZag to define the landscape, but use candle patterns or volume to trigger the actual trade. Don’t chase the line; wait for the market to prove the line is staying put.
Fine-Tuning Your MT4 Setup
To get the most out of this tool in 2026, don’t just use the default settings. The markets have become more volatile over the last few years. If you’re trading Forex pairs like GBP/JPY, you might need a higher Deviation to account for the ‘wicky’ nature of the pair. If you’re trading stable assets like Gold or the S&P 500, tighter settings might work better.
Also, consider the ‘Multi-Timeframe’ approach. Look at the ZigZag on a Daily chart to see the overall trend direction, then drop down to the 1-hour chart to find Fractal entries that align with that Daily trend. Trading with the ‘big’ ZigZag while entering on the ‘small’ Fractals is a classic recipe for a high risk-to-reward ratio.
A Human Approach to Technical Tools
At the end of the day, an indicator is just a calculation. It doesn’t know about interest rate hikes, geopolitical shifts, or sudden economic collapses. The ZigZag Fractals indicator is a visual aid, not a magic wand. It helps you keep your head cool when the candles are jumping around.
The real secret to using these tools is patience. Most traders fail because they are too eager to click ‘buy’ or ‘sell.’ They see a ZigZag line start to form and they jump in, only for the price to keep going and the line to repaint. By requiring a Fractal to form and the price to break a specific level, you build a system based on logic rather than impulse.
If you’re tired of cluttered charts and second-guessing every move, give the ZigZag Fractals combo a try. It forces you to look at the market’s structure, and in the world of trading, structure is everything.