
Understanding the Psychology of Market Panic
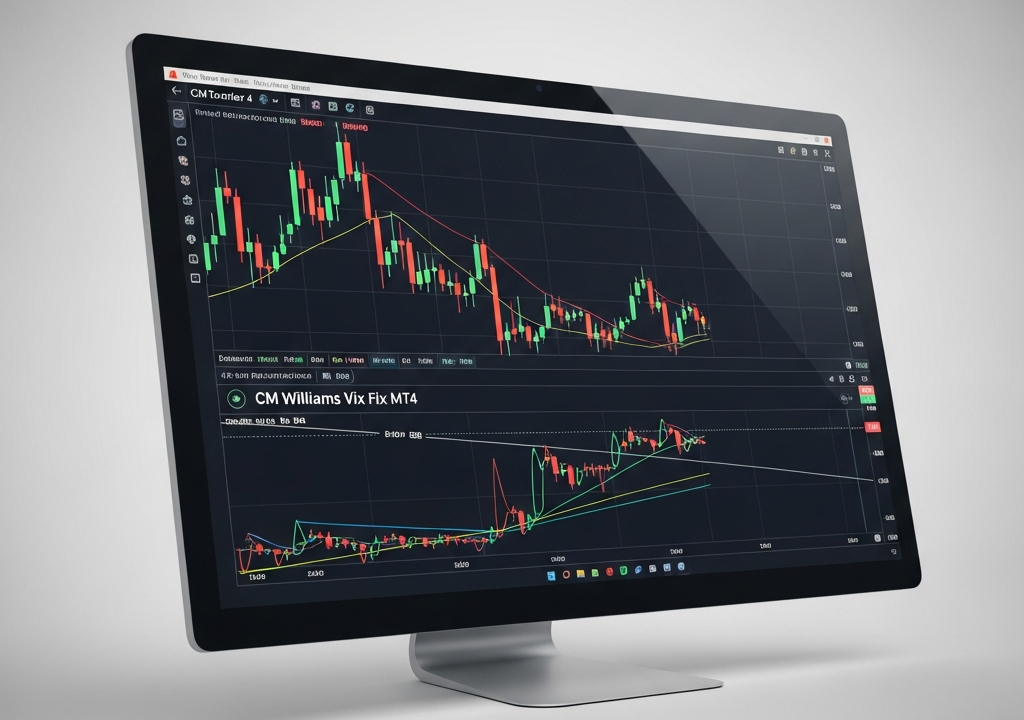
In the world of professional trading, price action is often just the surface of a much deeper ocean. Beneath every candle on your MetaTrader 4 terminal lies a layer of human emotion—specifically, fear and greed. While most indicators focus on where the price is going, the CM Williams Vix Fix Indicator MT4 focuses on how the market feels. It acts as a thermometer for market fever, specifically designed to detect when traders have reached a breaking point of panic.
Markets don’t just move; they breathe. They expand during periods of high volatility and contract during consolidation. The Vix Fix is a unique tool because it seeks to replicate the CBOE Volatility Index (VIX) for markets where a formal volatility index doesn’t exist, such as individual currency pairs in the Forex market. By understanding the intensity of a sell-off, you can position yourself for the inevitable snap-back that occurs when the selling pressure finally exhausts itself.
The Logic Behind the Synthetic VIX
The original VIX is often called the “fear gauge” for the S&P 500. It uses options pricing to determine expected volatility. However, Forex is a decentralized market. There is no single exchange to pull this data from. Larry Williams, a legendary figure in the trading world, solved this by creating a “synthetic” VIX. He realized that fear-driven volatility leaves a specific mathematical footprint in price action.
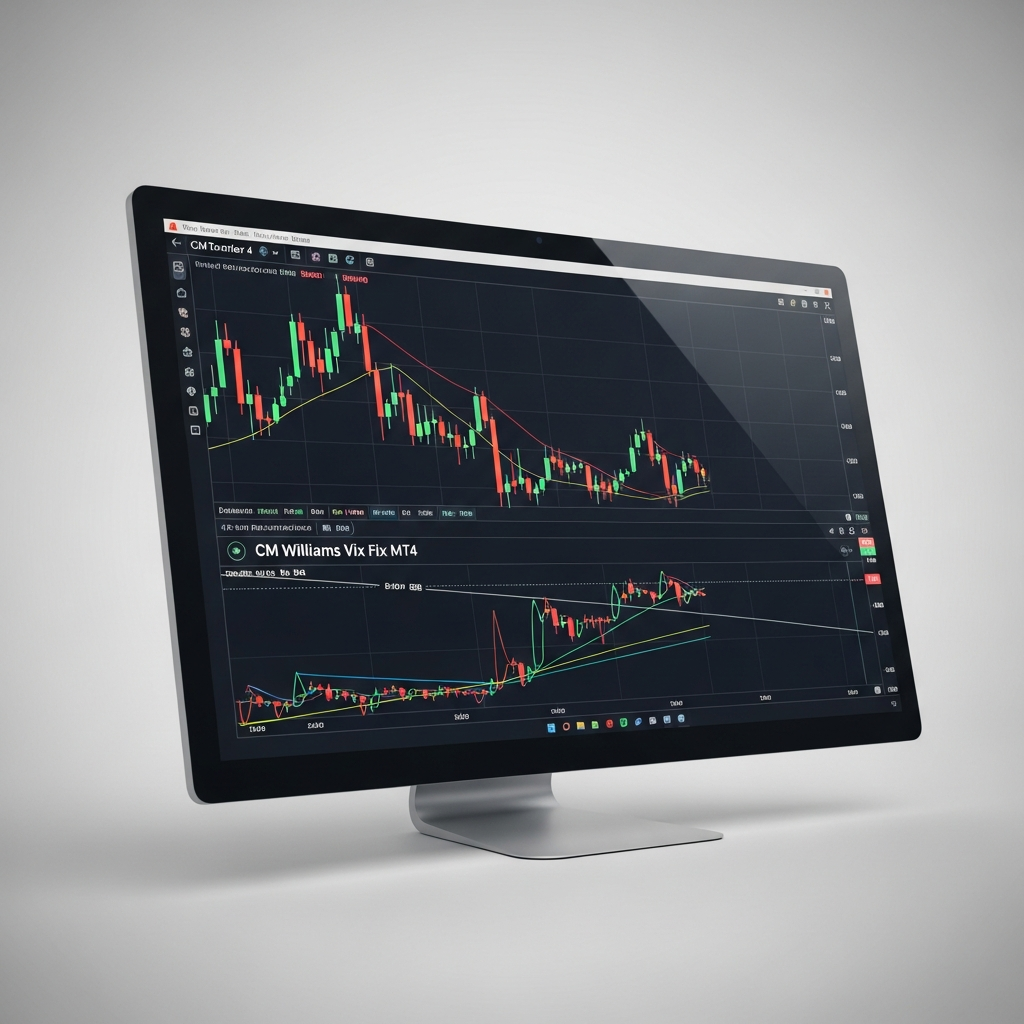
The CM Williams Vix Fix calculates the relationship between the current period’s low and the highest close over a specific lookback period (usually 22 bars). When the market drops sharply, the distance between that high-water mark and the current low expands rapidly. This causes the indicator to spike. These spikes represent “capitulation”—the moment where the last of the sellers finally gives up and exits the market. For a contrarian trader, this is the sound of opportunity knocking.
Why Volatility Matters More Than Price
Traditional oscillators like the RSI or Stochastics can stay “oversold” for a very long time during a strong downward trend. This leads many traders into the trap of buying too early. The Vix Fix is different. It doesn’t care about the trend as much as it cares about the velocity of the move. A slow, grinding downtrend might not trigger a Vix Fix spike, but a sudden, news-driven crash will. This distinction helps you filter out low-probability setups and focus on moments of genuine market exhaustion.
Setting Up the Indicator for Maximum Efficiency
One of the most frequent mistakes traders make is using default settings for every timeframe. While the standard 22-period lookback is a fantastic starting point, it isn’t a one-size-fits-all solution. Depending on your trading style, you should consider the following adjustments:
- For Day Traders (M15 to H1): Stick close to the 20-25 range. This provides enough sensitivity to capture intraday panics without being so noisy that every minor dip looks like a crash.
- For Swing Traders (H4 to Daily): Increase the lookback to 30 or even 40. This allows the indicator to account for broader market cycles and ensures that only significant structural shifts trigger a signal.
- For Scalpers (M1 to M5): Tighten the lookback to 15-18. Be warned, however, that on these lower timeframes, “panic” is often just noise created by a single large institution’s order flow.
Strategic Implementation: The Reversal Setup
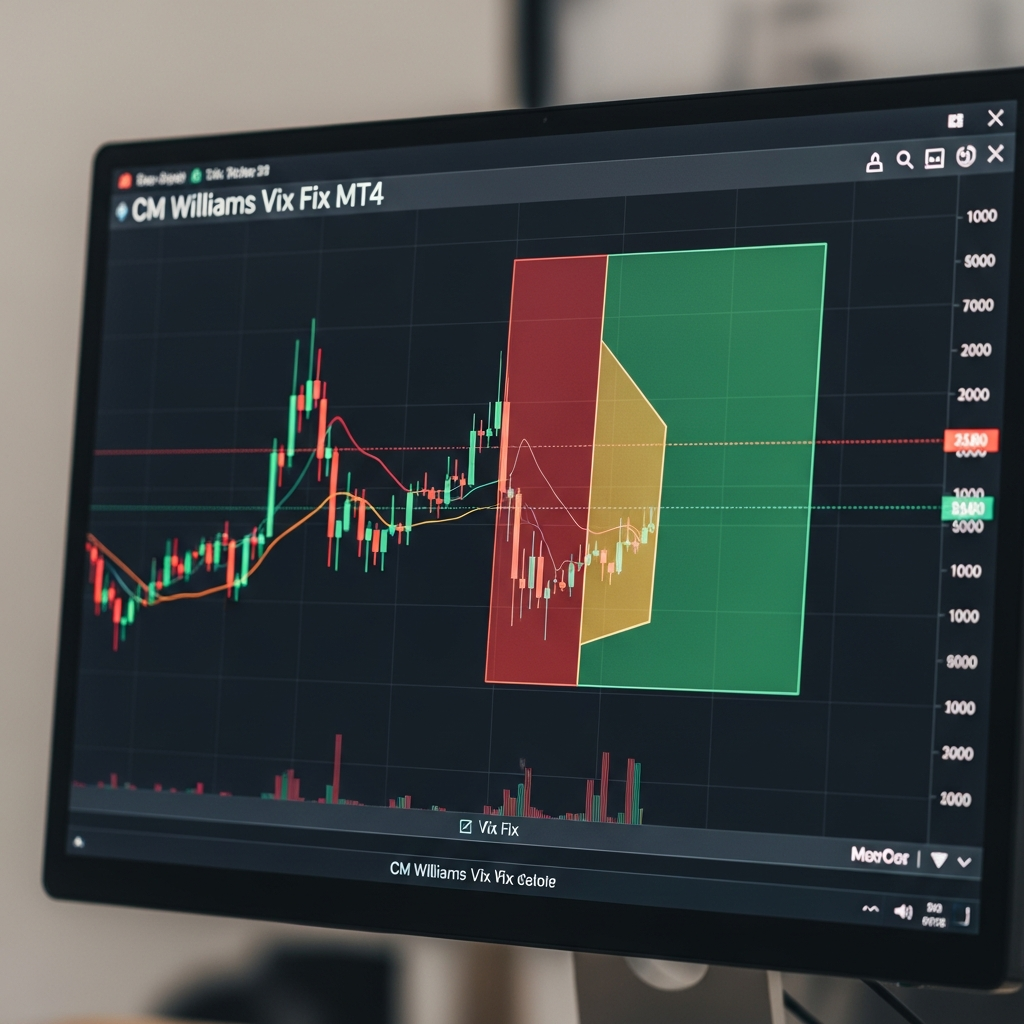
The CM Williams Vix Fix is not a “magic button.” You shouldn’t buy the moment you see a green spike. Instead, treat the indicator as a high-alert signal. When the indicator reaches an extreme level—often visually represented by a tall bar that stands out from the recent average—it’s time to look at your charts for secondary confirmation.
Combining with Support and Resistance
The most powerful way to use this tool is in conjunction with horizontal support levels. If the Vix Fix spikes at the exact moment price touches a major weekly or monthly support zone, the probability of a reversal increases exponentially. The spike tells you that the market is panicking, while the support level tells you where the buyers are likely waiting to catch the falling knife.
Candlestick Confirmation
Patience is the hallmark of a professional. After a Vix Fix spike, wait for a price action signal. A bullish engulfing candle, a long-wicked pin bar, or a morning star pattern provides the “go” signal. This confirmation ensures that the volatility has not only peaked but that the bulls have actually regained control of the price ladder.
Vix Fix vs. Traditional Indicators
To truly appreciate the value of the CM Williams Vix Fix, it helps to compare it with the tools most traders use. Let’s look at how it stacks up against the RSI and Bollinger Bands.
The RSI Comparison
The Relative Strength Index (RSI) measures the speed and change of price movements. While useful, it lacks a volatility component. In a crashing market, RSI will hit the 30 level and stay there, often sliding down the side of the chart like a wet noodle. The Vix Fix, however, provides a clear peak. It is much easier to identify a specific “moment” of exhaustion with a vertical spike than with a horizontal line dragging along the bottom of an RSI window.
The Bollinger Band Comparison
Bollinger Bands are great for seeing price extremes, but they can be visually cluttered. When price “walks the bands,” it can be difficult to tell if a reversal is coming or if the trend is just accelerating. The Vix Fix simplifies this by stripping away the price overlay and giving you a dedicated sub-window focused purely on the volatility expansion. It’s cleaner, more direct, and less prone to subjective interpretation.
Risk Management in Volatile Markets
High volatility is a double-edged sword. While it offers the highest potential rewards, it also carries the highest risk of slippage and rapid drawdowns. When trading based on Vix Fix signals, your stop-loss placement is critical. A common technique is to place the stop-loss several pips below the lowest point of the panic spike. This allows the trade enough room to breathe while ensuring you exit if the market decides to take another leg down.
Additionally, pay attention to the economic calendar. A Vix Fix spike during a major event like a Non-Farm Payroll (NFP) release or a central bank interest rate decision is different from a spike on a random Tuesday. During news events, volatility can stay elevated for a long time. It is often wiser to wait for the post-news dust to settle before trusting any indicator signal.
Final Perspective on Market Timing
The CM Williams Vix Fix Indicator MT4 is essentially a mirror reflecting the collective anxiety of the market. By using it, you aren’t just following lines on a chart; you are identifying the moments when the crowd has lost its cool. While it excels at picking bottoms in bearish markets, it requires discipline to master. It demands that you be the calm observer when everyone else is panicking.
Integrate this tool into a broader strategy that includes market structure analysis and sound money management. Don’t chase every spike, and never trade without a stop-loss. With time and practice, you will begin to see these volatility peaks not as threats, but as the starting blocks for the next major market move.