
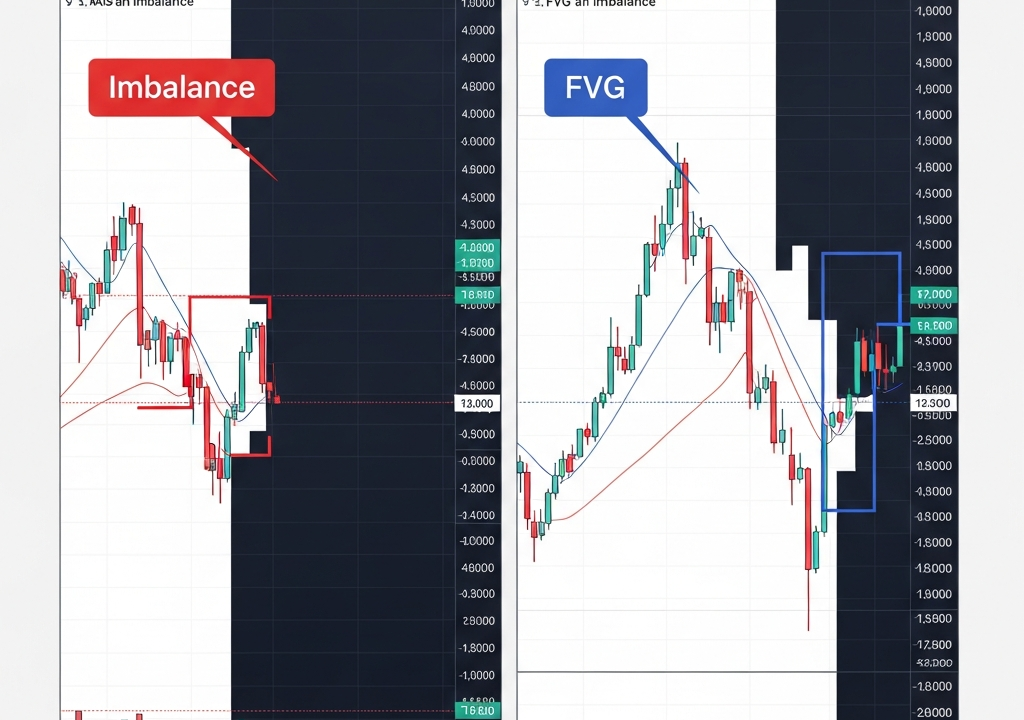
Understanding Price Inefficiency in Modern Trading
If you have spent any time in the world of Smart Money Concepts (SMC) or Inner Circle Trader (ICT) methodology, you have likely heard the terms “imbalance” and “Fair Value Gap” (FVG) tossed around like they are the same thing. In many Telegram groups and Discord servers, traders use them interchangeably. However, if you want to move from being a casual retail observer to a precise chart reader, you need to understand that while they are related, they are not identical.
Think of it like this: every square is a rectangle, but not every rectangle is a square. In the same vein, every Fair Value Gap is an imbalance, but the world of imbalances includes much more than just three-candle gaps. Misidentifying these zones leads to messy charts, premature entries, and a fundamental misunderstanding of why price is moving the way it is. By 2026, the markets have become even more algorithmic, making the precision of these levels more important than ever.
The Hierarchy: Imbalance as the Umbrella
In the broadest sense, an imbalance is any price range where buying and selling pressure were not matched. Imagine an auction where a high-end watch is being sold. If the price jumps from $5,000 to $10,000 in a split second because one buyer was willing to pay anything, the prices in between ($6,000, $7,000, etc.) were never truly “tested.” The market was one-sided.
In technical analysis, an imbalance represents a zone where price moved so rapidly in one direction that it left an inefficiency behind. The market essentially skipped over those price levels. According to the theory of mean reversion and algorithmic efficiency, the market has a natural tendency to return to these “unfilled” areas to offer fair value to both buyers and sellers once again.
Under the broad umbrella of imbalance, we find three primary specific patterns:
- Fair Value Gap (FVG): The most recognizable and precise three-candle pattern.
- Volume Imbalance: A gap specifically between candle bodies where wicks still overlap.
- Liquidity Void: A massive, multi-candle vacuum of price action.
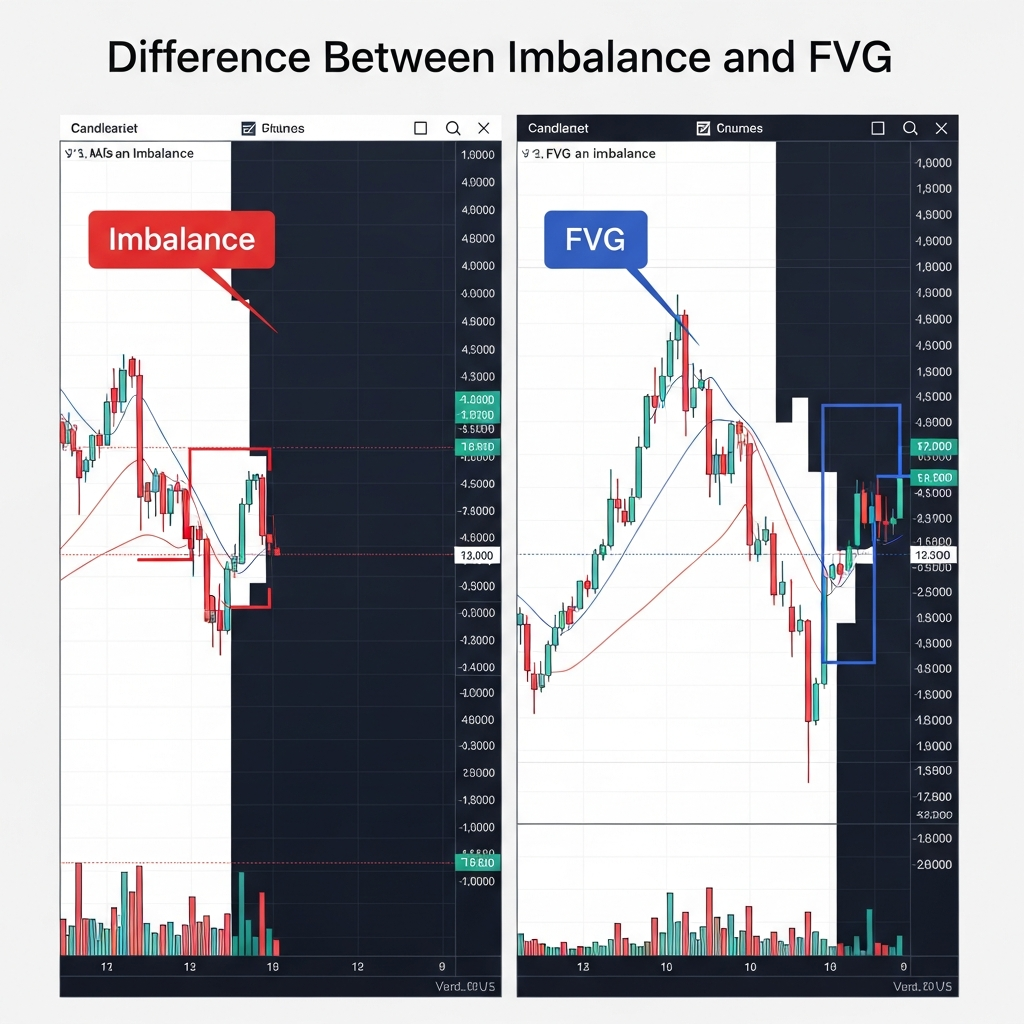
Decoding the Fair Value Gap (FVG)
The Fair Value Gap is the most popular type of imbalance because it is the easiest to quantify. It is defined by exactly three consecutive candles. To find one, you look for a large middle candle (Candle 2) that shows significant displacement.
The Three-Candle Rule
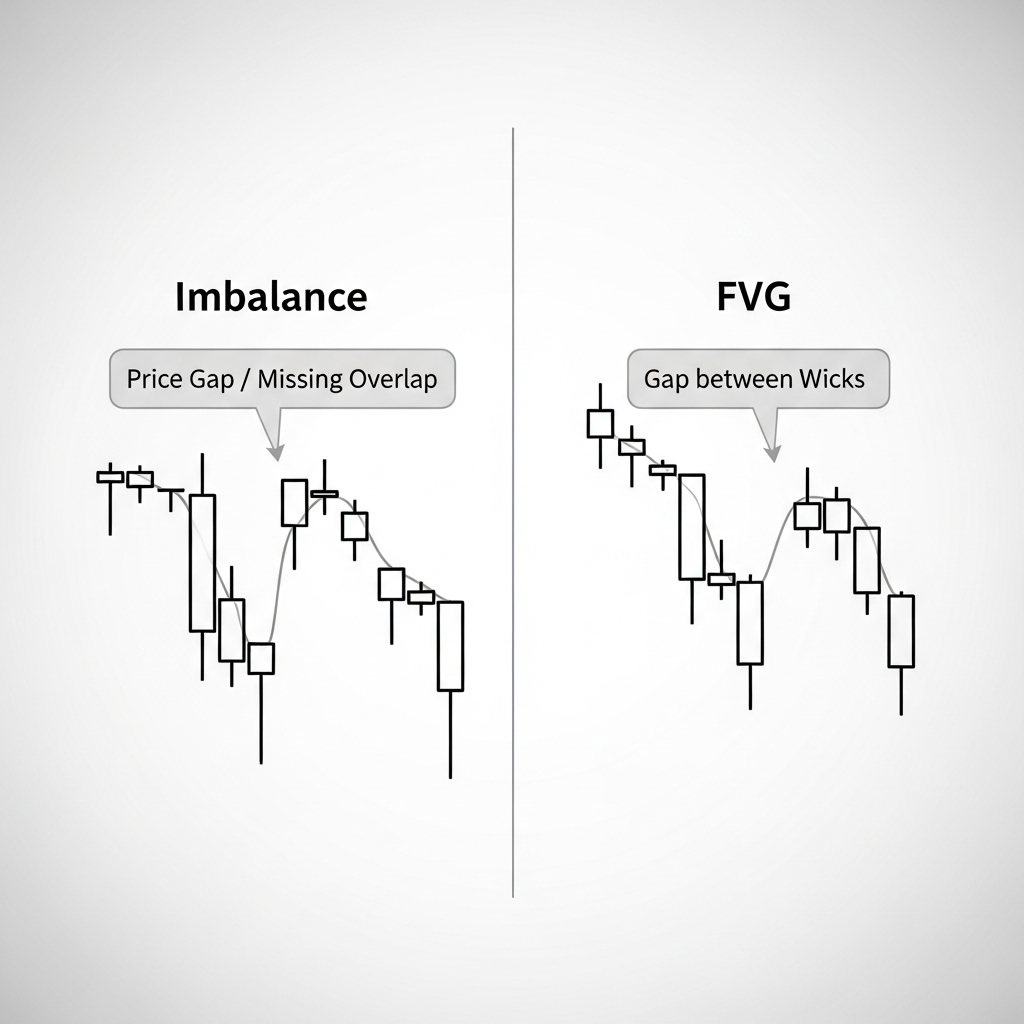
To identify a bullish FVG (often called a BISI), you look at the high of Candle 1 and the low of Candle 3. If there is a gap between the top of Candle 1’s wick and the bottom of Candle 3’s wick, that empty space is your Fair Value Gap. It means that during the duration of Candle 2, price moved so fast that the buyers and sellers from the previous and following candles never had a chance to interact at those price points.
The inverse applies to a bearish FVG (often called a SIBI). You look at the low of Candle 1 and the high of Candle 3. If there is a gap between them, you have a bearish inefficiency. The middle of this gap is known as the Consequent Encroachment (CE). In many algorithmic models, the CE acts as a magnet or a level where price is likely to react if it doesn’t fill the entire gap.
BISI vs. SIBI: Just Labels
Don’t let the acronyms intimidate you. BISI stands for Buy-side Imbalance, Sell-side Inefficiency. It just means the market moved up so fast that sellers couldn’t participate. SIBI stands for Sell-side Imbalance, Buy-side Inefficiency, meaning the market dropped so fast that buyers were left behind. They are simply directional names for the same core phenomenon.
Volume Imbalances and Liquidity Voids
While the FVG is the star of the show, the other members of the imbalance family are equally important for a complete narrative of the chart.
Volume Imbalance
A volume imbalance occurs when the wicks of two candles overlap, but the bodies do not. For example, if Candle A closes at 1.1000 and Candle B opens at 1.1005, there is a 5-pip gap where no actual “volume” (in terms of candle bodies) was transacted, even if the wicks reached into that zone. These are often seen during news events or session opens and act as very sensitive areas for price rejections.
Liquidity Void
A liquidity void is the “big brother” of the FVG. While an FVG is a three-candle affair, a liquidity void is a long, sustained run of large candles with very small wicks. Think of a massive 50-pip green bar on a 5-minute chart following a central bank announcement. This entire run is a void. It represents a total lack of liquidity on one side of the market. These voids are eventually filled, but they can take much longer to resolve than a simple FVG.
How to Use Imbalances Without Overtrading
The biggest mistake new traders make is treating every FVG or imbalance as a “buy” or “sell” signal. If you look at a 1-minute chart, you will see dozens of these gaps. Most of them are noise. To trade them effectively, you must use context.
1. Displacement is Mandatory
An imbalance only matters if it was created by displacement. Displacement is a clear, energetic move that breaks market structure. If the market is just ranging and leaves a tiny gap, ignore it. You want to see the market “declare” its intent with a powerful move that leaves an imbalance in its wake.
2. Higher Time Frame (HTF) Alignment
An FVG on a 5-minute chart is significantly more powerful if it aligns with a 4-hour or Daily trend. If the Daily chart is bearish and you see a bearish FVG on the 15-minute chart after a liquidity sweep, that is a high-probability setup. Trading a bullish FVG in a bearish market is a recipe for getting stopped out.
3. The Concept of Confluence
Don’t just trade the gap. Look for where the gap sits. Does it overlap with a previous Order Block? Is it sitting at a 0.5 Fibonacci retracement level (Discount/Premium)? When an FVG lines up with other technical levels, it becomes a high-conviction Point of Interest (POI).
A Practical Trading Example
Let’s walk through a hypothetical setup on the GBP/USD. The daily trend is bullish. During the New York session, price drops to sweep the previous day’s low (a liquidity sweep). Immediately after the sweep, price rockets upward, breaking a recent swing high on the 15-minute chart. This is a Change of Character (CHoCH).
This aggressive move leaves behind a large FVG between 1.2510 and 1.2530. Instead of chasing the price as it moves up, you set a limit order or wait for price to return to this gap. When price retraces into the FVG, you look at the 1-minute chart for a smaller structure shift. Your stop loss goes below the low of the displacement move (Candle 1 of the FVG), and your target is the recent swing high. This approach uses the imbalance as an entry trigger rather than a blind guessing game.
The Brutal Reality of Gap Fills
There is a common myth that “all gaps must be filled.” While it is true that markets tend to seek efficiency, there is no rule saying they have to do it now. Some imbalances remain open for weeks, months, or even years. In a strongly trending market, price may only dip into the top 25% of an FVG before continuing its run, leaving the rest of the gap open. This is known as a “runaway gap.”
Never assume a reversal just because a gap was filled. Price can easily fill an FVG and keep going right through it, invalidating the zone entirely. This is why risk management is non-negotiable. If price closes decisively through an imbalance zone, the thesis is dead. Move on to the next setup.
Common Pitfalls to Avoid
- Focusing on Bodies: Remember, the FVG is defined by the wicks of candles 1 and 3. If the wicks touch, the gap is closed, regardless of what the bodies look like.
- Ignoring the Macro: A 1-minute FVG against a Weekly trend is just a speed bump. Always check the higher time frames first.
- Over-complicating Labels: Don’t get hung up on whether something is a BISI or a SIBI. Focus on the logic: Is the market inefficient? Is there a reason for price to return here?
- The “Magic Number” Fallacy: There is no statistical proof that FVGs fill 80% of the time. Treat every setup as a unique probability, not a certainty.
Summary: The Professional Perspective
By 2026, the distinction between these terms has become a hallmark of professional retail trading. Understanding that an imbalance is the broad category of inefficiency, while the Fair Value Gap is a specific, actionable three-candle pattern, allows you to communicate more clearly and trade more precisely.
Use these zones as footprints left by institutional algorithms. When the big players move, they leave a mess. Your job isn’t to predict where they will go next, but to identify these messy, inefficient zones and wait for price to return to them with a clear plan. Combine these gaps with market structure and sound risk management, and you have a framework that stands the test of time in any market condition.
Frequently Asked Questions
Is a Fair Value Gap the same as a liquidity void?
No. An FVG is a specific three-candle pattern. A liquidity void is a much larger, multi-candle move that represents a total vacuum in the market. You will often find several FVGs nested inside a single liquidity void.
Why does price return to fill an imbalance?
The theory suggests that because price moved too fast, many orders were left unfilled. Market-making algorithms are designed to facilitate trade and provide liquidity; returning to these zones allows the market to “re-auction” those prices and ensure a fair distribution of orders.
Can I trade imbalances on any timeframe?
Yes, but the reliability increases with the timeframe. A Daily FVG is much more significant than a 1-minute FVG. Most professional SMC traders use higher timeframe imbalances to find their bias and lower timeframe imbalances to refine their entries.
What is the Consequent Encroachment?
It is simply the 50% equilibrium point of an FVG or a Liquidity Void. Algorithmic price action often respects the 50% level of an inefficiency, even if it doesn’t fill the entire zone.