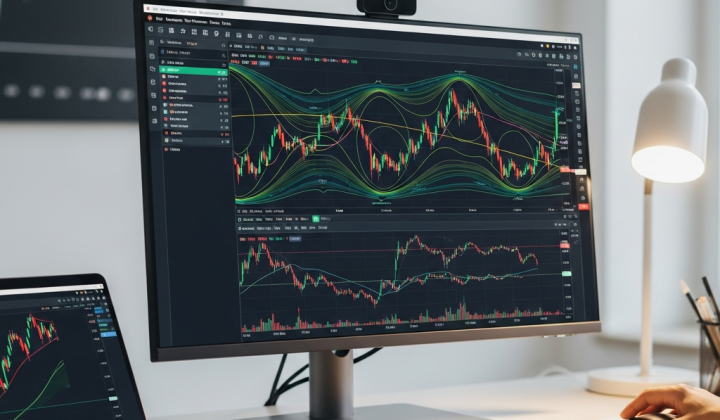

The Reality of Trading in 2026
Let’s be honest for a second. If you have spent any time staring at currency charts lately, you know the market is a chaotic beast. We are seeing intraday volatility that would have made traders a decade ago sweat. Yet, despite the rise of high-frequency algorithms and AI-driven liquidity sweeps, one fundamental truth of the market remains unchanged: money is made when you catch a wave and ride it as long as possible.
Trend following isn’t about being right every time; it is about being right enough to let your winners dwarf your losers. In 2026, the noise is louder, but the trends are still there. If you are tired of getting chopped up in sideways ranges or trying to pick the exact top or bottom of a move, it is time to return to the basics. Here is how you can use trend-following systems to navigate the current forex landscape.

1. The Dual Exponential Moving Average (EMA) Pullback Strategy
The most common mistake traders make with moving averages is using them as a signal to buy exactly when they cross. In a choppy market, that is a recipe for a “whipsaw”—where you enter just as the momentum dies. Instead, we want to use moving averages as a filter for direction and a zone for entries.
The Setup
We use the 50-period EMA and the 200-period EMA. The 200 EMA tells us the long-term sentiment, while the 50 EMA acts as our dynamic support or resistance. If the 50 is above the 200, we are only looking for buys. If it is below, we are only looking for sells.
How to Trade It
- Wait for the Gap: Look for a clear space between price and the 50 EMA. This shows strong momentum.
- The Retracement: Instead of chasing the price, wait for it to pull back and touch the 50 EMA.
- The Rejection: Look for a bullish or bearish engulfing candle right at that moving average line. This is your green light.
This strategy keeps you on the right side of the institutional flow while ensuring you aren’t buying at the most expensive price of the day.
2. The MACD Momentum Burst
The Moving Average Convergence Divergence (MACD) is an old-school tool, but it is incredibly effective when you stop using it for “divergence” and start using it for momentum confirmation. Most people lose money with the MACD because they try to predict a reversal. We are going to do the opposite.
The Setup
Set your MACD to the standard (12, 26, 9). We are looking for the “Zero Line Cross.” When the MACD histogram moves from negative to positive territory, it signals that the short-term momentum has officially overtaken the long-term average.
How to Trade It
Don’t just enter when it crosses. Wait for a price breakout of a recent swing high simultaneously. When the MACD bars are growing in height and price is breaking a local resistance level, you have a high-probability trend entry. This strategy works exceptionally well on the 4-hour and Daily timeframes where the “noise” of 2026’s news cycles is smoothed out.
3. The Ichimoku Cloud Breakout (Kumo Break)
If you want a system that does everything for you—identifies trend, support, resistance, and momentum—the Ichimoku Kinko Hyo is it. While the chart looks like a mess of spaghetti at first, the “Cloud” (Kumo) is the most powerful part of the indicator.
The Setup
The Cloud represents a zone of volatility. When price is inside the cloud, the market is undecided. When price is above the cloud, the trend is bullish. When it is below, it is bearish.
How to Trade It
- The Breakout: Wait for a full candle to close above the cloud.
- The Confirmation: Look at the Chikou Span (the lagging line). If it is also in open space and not hitting price candles, the path of least resistance is clear.
- The Exit: Stay in the trade as long as the price remains above the cloud. This allows you to catch those massive 300-400 pip moves that happen on pairs like GBP/JPY.

4. Heikin Ashi and the Stochastic Filter
One of the hardest parts of trend following is the psychological toll of seeing red candles during a pullback. Heikin Ashi candles solve this by averaging price data to create a smoother visual representation of the trend. In 2026, where “fakeouts” are common, this smoothing is a lifesaver.
The Setup
Switch your chart from standard Japanese Candlesticks to Heikin Ashi. Add a Stochastic Oscillator (14, 3, 3) to the bottom of your chart.
How to Trade It
In a clear uptrend, you will see a series of green Heikin Ashi candles with no lower wicks. This indicates strong buying pressure. When the price takes a breather, the Stochastic will drop into the oversold region (below 20). Wait for the Stochastic to cross back upward while the Heikin Ashi candles turn green again. This is your signal that the trend has resumed and the “dip” has been bought.
5. Bollinger Band Squeeze and Expansion
Volatility is cyclical. It goes from periods of extreme quiet to periods of extreme movement. The Bollinger Band Squeeze strategy is designed to catch a trend at its very birth.
The Setup
Look for the Bollinger Bands to become very narrow—this is the “Squeeze.” It tells us that the market is building up energy like a coiled spring. In 2026, these squeezes often happen before major central bank announcements.
How to Trade It
We don’t guess the direction. We wait for a candle to close outside of the bands. If a candle closes above the upper band, we buy. If it closes below the lower band, we sell. The key here is to use a trailing stop. As the bands expand, the trend will often ride the “outer wall” of the band. Stay in the trade until the price touches the middle 20-period moving average line.
Why Most Traders Fail with These Strategies
If these strategies work, why isn’t everyone a millionaire? The answer isn’t the indicators; it’s the person using them. Trend following requires a specific mindset that goes against human nature. Humans want to buy low and sell high. Trend followers buy high and sell higher.
The Problem of Patience
In a trend-following system, you will have periods of “drawdown” where the market goes sideways. You might take three or four small losses in a row. Most traders give up right before the big trend starts. Success in 2026 requires the discipline to stick to the rules even when the market feels stagnant.
Position Sizing is the Secret Sauce
Because trend following involves a lower win rate but a higher “reward-to-risk” ratio, you cannot afford to risk 5% or 10% of your account on a single trade. If you do, a string of three losses will blow your account before you hit the big winner. Aim to risk no more than 1% per trade. This gives you the “staying power” to survive the choppy periods.
Adapting to the 2026 Market Environment
The forex market today is influenced heavily by liquidity sweeps—where price briefly breaks a level to trigger stop losses before reversing. To combat this, give your stop losses more room to breathe. Instead of placing your stop exactly at a support level, place it a few pips below the recent swing low, or use the Average True Range (ATR) to calculate a volatility-based stop.
Remember, the goal isn’t to find a “magic” indicator. The goal is to find a repeatable process that puts the mathematical odds in your favor. Whether you prefer the visual clarity of Heikin Ashi or the structural depth of the Ichimoku Cloud, pick one system and stick with it for at least 100 trades. Only then will you see the true power of following the trend.
Final Thoughts
Trading doesn’t have to be a high-stress gamble. By shifting your focus from “predicting” what will happen to “reacting” to what is actually happening, you remove the emotional weight of trading. The trend is a physical manifestation of the world’s capital moving from one currency to another. Don’t try to stand in its way. Instead, learn to identify the momentum, wait for your entry, and have the courage to hold on for the ride.