The Hidden Language of Market Symmetry
If you have spent more than five minutes looking at a forex chart, you have likely noticed those moments where price seems to hit an invisible ceiling or floor multiple times at almost the exact same level. In the world of retail trading, these are often called double tops or double bottoms. However, in the realm of professional institutional trading, we call these Equal Highs (EQH) and Equal Lows (EQL).
Understanding these patterns isn’t just about identifying shapes on a screen. It is about understanding where the ‘fuel’ for the market is hidden. In 2026, algorithmic trading dominates the landscape, and these algorithms are programmed to hunt for specific areas of liquidity. Equal highs and lows are the primary maps they use to find that liquidity. If you don’t know where the liquidity is, you are likely the liquidity yourself.
Defining Equal Highs and Equal Lows
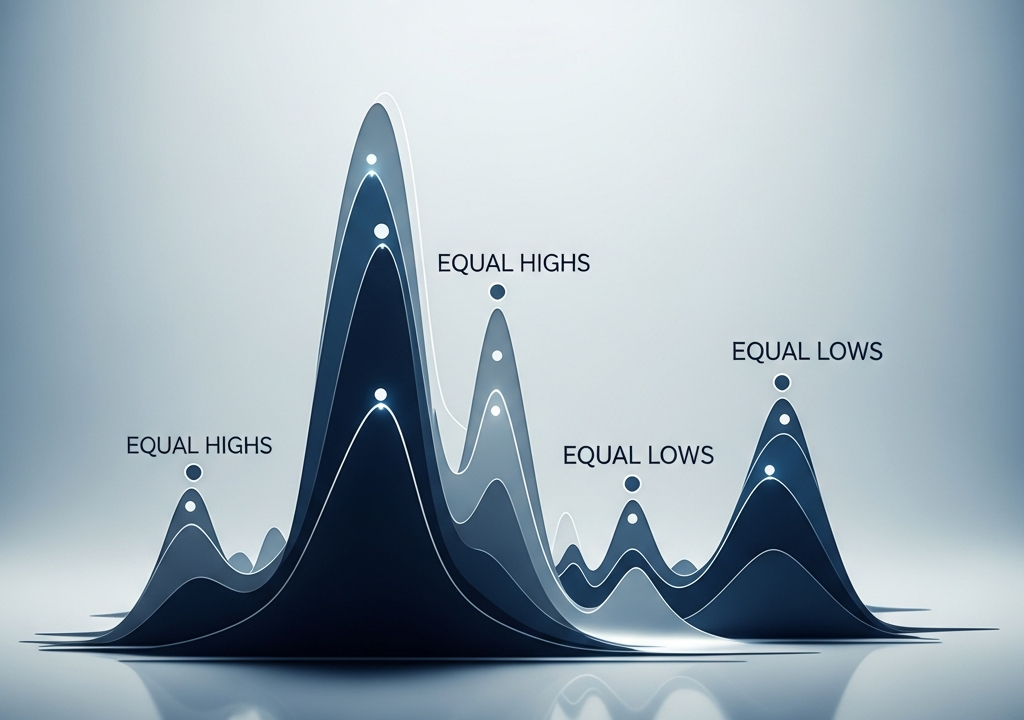
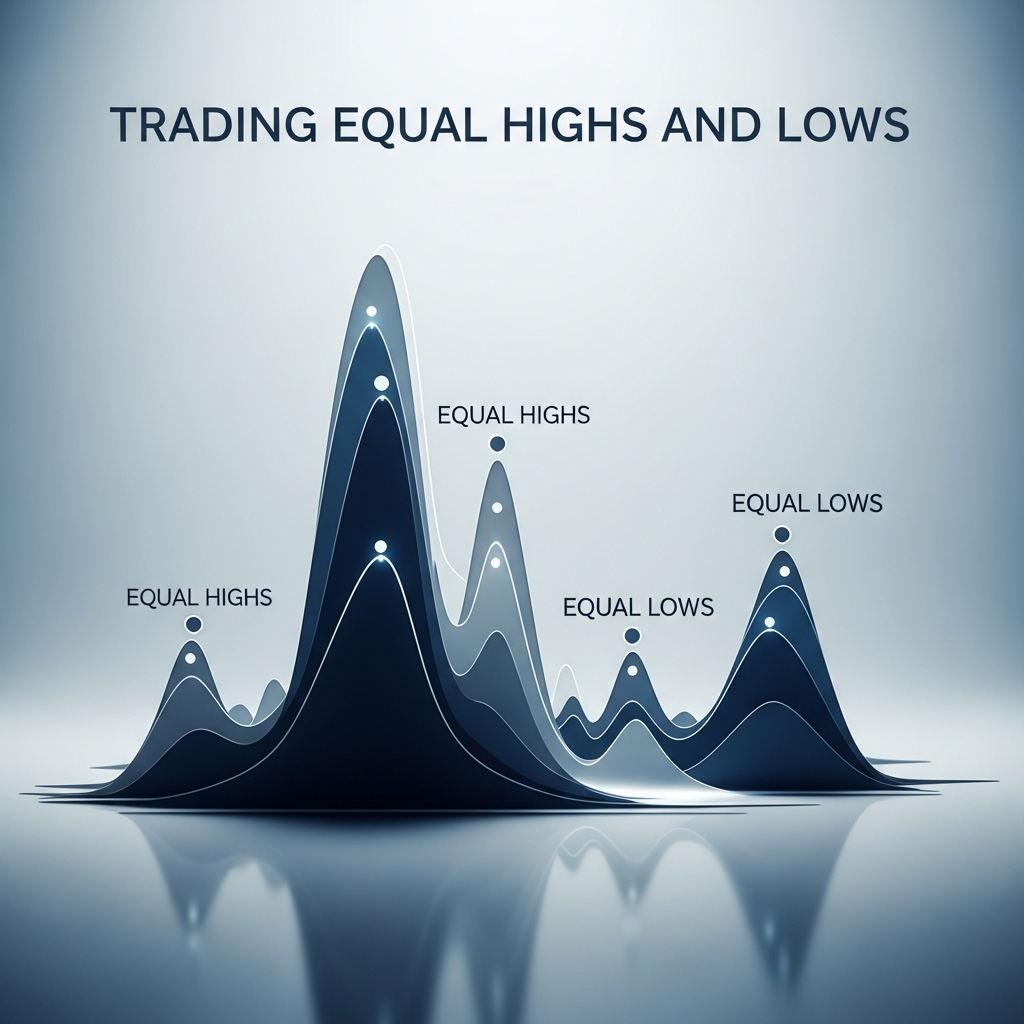
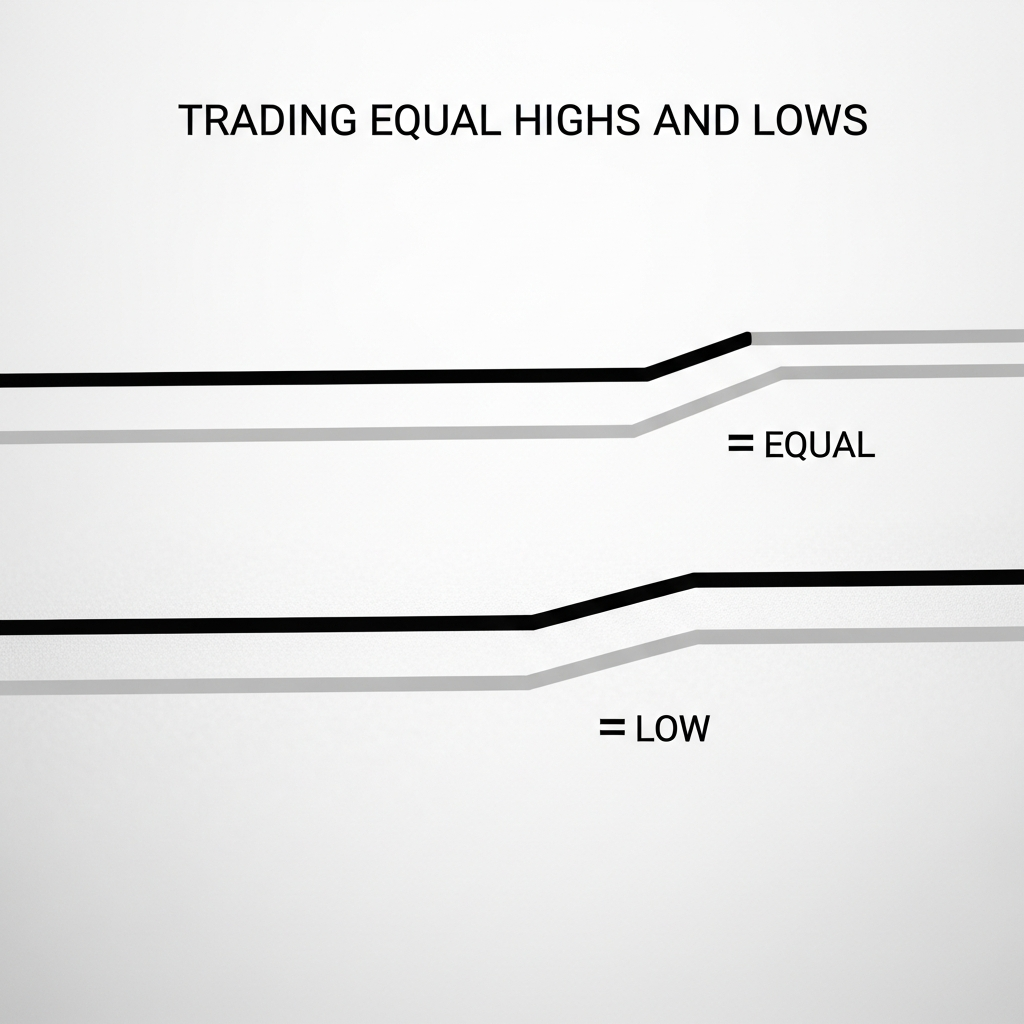
At its simplest level, Equal Highs occur when two or more price peaks reach the same horizontal level. Conversely, Equal Lows occur when two or more price troughs bottom out at the same level. While ‘equal’ suggests a perfect mathematical match, in a live market, we usually allow for a few pips of deviation. The visual effect is a flat line of resistance or support that looks incredibly sturdy.
Retail logic suggests that the more times a level is tested, the stronger it becomes. Institutional logic suggests the exact opposite: the more times a level is tested, the more liquidity builds up behind it, making it a high-probability target for a breakout or a ‘sweep’.
The Concept of Liquidity Pools
Why do these levels matter so much? It all comes down to orders. When price creates Equal Highs, thousands of retail traders place ‘Sell’ orders at that resistance, putting their ‘Buy Stop’ (stop loss) orders just above those highs. Similarly, at Equal Lows, traders place ‘Buy’ orders and tuck their ‘Sell Stop’ orders just beneath the lows.
These clusters of stop-loss orders are known as liquidity pools. For a large bank or institution to enter a massive ‘Buy’ position, they need an equal amount of ‘Sell’ orders to match against. By driving the price just below Equal Lows, they trigger all those retail sell stops, providing the liquidity they need to fill their large buy orders at a better price. This is often why you see price ‘fake out’ below a level before aggressively reversing in the opposite direction.
How to Identify High-Probability EQH and EQL
Not every flat top or bottom is worth your attention. To trade these effectively, you need to look at the context of the market structure. Here is what to look for when scanning your charts:
- Timeframe Significance: Equal highs on a 1-minute chart are noise. Equal highs on a 4-hour or Daily chart are a major market catalyst. Always prioritize higher timeframe levels.
- Cleanliness: The ‘cleaner’ the level looks, the more retail eyes are on it. If it looks like a perfect double top, it is a massive magnet for price to eventually sweep through.
- Proximity to Key Zones: Look for EQH or EQL that sit just below a major supply zone or just above a major demand zone. These are often ‘engineered’ to lure traders into positions before the real move happens.
The Psychology of the Trap
Trading is as much about psychology as it is about charts. When price approaches Equal Highs for the third or fourth time, the retail trader feels a sense of confidence. They think, “This level is holding perfectly!” This confidence leads to larger position sizes and tighter stop losses. This is exactly what the market makers want. They are building a ‘wall of money’ that they can eventually crash through to fuel a large directional move.
By shifting your mindset to see these levels as targets rather than barriers, you align yourself with the smart money. Instead of thinking “I should sell here because it’s a double top,” you should be thinking “Price will likely come back to clear these highs eventually.”
Trading Strategies Using Equal Highs and Lows
There are two primary ways to trade these formations. One involves using them as a target, and the other involves trading the ‘sweep’ itself.
1. Using EQH/EQL as Profit Targets
If you are already in a trade based on a trend reversal or a supply/demand flip, Equal Highs and Lows make for excellent Take Profit (TP) locations. Because price is naturally drawn to these liquidity pools, the probability of price reaching that level is significantly higher than a random point on the chart. If you are long and see Equal Highs above your entry, that is your exit zone.
2. The Liquidity Sweep and Reversal
This is a more advanced strategy. Instead of trading *at* the equal lows, you wait for the price to break *below* them. You are looking for a ‘Stop Run’. The setup looks like this:
- Identify clear Equal Lows.
- Wait for price to drop below the lows, triggering the sell stops.
- Look for a fast rejection—a long wick or a strong bullish candle closing back above the original level.
- Enter on the ‘displacement’ (the aggressive move back) with a stop loss below the new swing low.
This strategy ensures you are entering the market *after* the weak hands have been shaken out and the institutional orders have been filled.
Common Pitfalls to Avoid
Even with a solid understanding of liquidity, it is easy to get caught on the wrong side of the move. One common mistake is trying to pick the exact moment of the sweep. Sometimes price will hang around equal highs for days before finally clearing them. Patience is vital.
Another mistake is ignoring the overall trend. If the market is in a powerful bullish trend, Equal Highs are almost guaranteed to be broken. Do not try to sell them. Instead, look for Equal Lows to be formed as ‘inducement’ before price continues its upward trajectory. In a trending market, liquidity is usually taken from one side to fuel the move toward the other.
The Role of Time and Session Volatility
In 2026, the timing of these moves is more predictable than ever. Liquidity sweeps often occur during the ‘Silver Bullet’ hours or the London/New York session opens. This is when the highest volume enters the market. If you see Equal Highs heading into the New York Open, there is a very high chance the opening volatility will be used to sweep those highs before the ‘real’ move of the day begins. Always check your economic calendar and session clocks before engaging with these setups.
Summary of Key Takeaways
Equal Highs and Equal Lows are not just chart patterns; they are the footprints of institutional activity. By recognizing that these levels represent pools of stop-loss orders, you can avoid common retail traps and find high-probability entry and exit points. Remember that the market exists to facilitate trade, and to facilitate trade, it must move toward the areas with the most orders. Treat every clean horizontal level as a magnet, and you will find yourself on the right side of the chart more often than not. Trading is a game of following the money, and Equal Highs/Lows are where the money is parked.