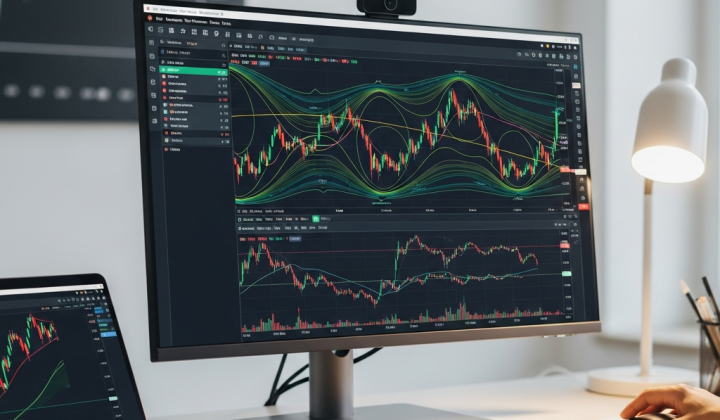

The Evolution of Volume Analysis in Modern Trading
As we navigate the complex financial landscape of 2026, the tools we use to interpret market sentiment have become more streamlined and intuitive. One such tool that has stood the test of time while evolving for the modern trader is the Candle Volume Indicator for MetaTrader 5 (MT5). Historically, traders had to split their focus between the main price chart and a separate volume histogram at the bottom of the screen. This constant ocular shifting often led to missed entries or a fragmented understanding of price action.
The Candle Volume Indicator changes this dynamic by embedding volume data directly into the price candles themselves. By merging these two critical data points—price movement and participation intensity—traders gain a holistic view of the market’s conviction without cluttering their workspace. It transforms the chart from a simple map of ‘where’ price went into a detailed narrative of ‘how’ it got there.
Understanding the Core Mechanics of Integrated Volume
In the world of Forex, volume is often misunderstood. Unlike the stock market, where we have a centralized exchange reporting every share traded, Forex relies on ‘tick volume.’ This measures the frequency of price changes within a specific timeframe. While it isn’t a direct count of dollars traded, tick volume is highly correlated with actual liquidity and market activity. The Candle Volume Indicator MT5 takes this tick data and translates it into visual cues.
When you apply this indicator, you’ll notice that candles are no longer just red or green boxes. Their appearance changes based on the activity behind them. A ‘heavy’ candle—one with high tick volume—might appear brighter, thicker, or carry a specific color outline. Conversely, a ‘thin’ candle represents a period of low interest, perhaps during a bank holiday or the quiet hours between the New York close and the Asian open.

The Logic: Strength vs. Exhaustion
The primary goal of this tool is to help you distinguish between a genuine move and a ‘fake-out.’ Imagine a large bullish candle climbing toward a resistance level. If that candle is accompanied by high volume, it tells you that big players are actively pushing the price higher. However, if you see a large price jump on very low volume, it’s a red flag. It suggests that the move lacks support and could be a trap set by low liquidity.
Strategic Implementation in the 2026 Market
Trading with the Candle Volume Indicator MT5 isn’t about following a single signal; it’s about building a case for every trade. Here is how professional traders are utilizing this integration in today’s high-speed markets.
1. The Breakout Filter
Breakout trading is one of the most popular yet dangerous strategies. The Candle Volume Indicator serves as your first line of defense. When price approaches a key level like a multi-month high or a pivot point, watch the candle colors. A successful breakout usually requires a surge in participation. If the candle that breaches the resistance is visually highlighted as ‘High Volume,’ the probability of a sustained trend increases significantly.
- Valid Breakout: Price breaks resistance + High Volume Candle color = High probability buy.
- False Breakout: Price breaks resistance + Low Volume Candle color = Likely reversal/trap.
2. Spotting Market Exhaustion
Markets don’t move in straight lines; they breathe. Often, the end of a trend is marked by a ‘climax’—a massive spike in volume that signifies everyone has finally jumped in. When you see an abnormally large volume candle at the end of a long move, it often means there are no buyers (or sellers) left to keep the momentum going. This visual spike is a signal to tighten your stops or look for a reversal entry.
3. Trend Confirmation
In a healthy trend, the candles moving in the direction of the trend should consistently show higher volume than the corrective pullbacks. If you are in a bullish trend and notice that the red ‘down’ candles are showing higher volume than the green ‘up’ candles, the trend is losing its health, even if price is still making slightly higher highs. This divergence is a subtle warning that a change in character is coming.

Customizing Your MT5 Setup
One of the strengths of the MT5 platform is its deep customization. The Candle Volume Indicator allows you to tailor the experience to your specific trading style. Whether you are a fast-paced scalper or a patient swing trader, the settings matter.
Volume Thresholds
You can set specific parameters for what the indicator considers ‘High’ or ‘Extreme’ volume. A scalper working on the 1-minute chart will want these thresholds to be sensitive to catch quick shifts in momentum during the London open. A daily chart trader, however, will want to filter out the noise and only see volume spikes that represent significant institutional shifts.
Visual Preferences
Some traders prefer the ‘Heatmap’ approach, where candles change through a gradient of colors (e.g., from dull grey to bright blue) as volume increases. Others prefer a simple binary view: ‘Normal’ vs. ‘Alert.’ In 2026, with the rise of 4K and 8K trading monitors, having a clean, color-coded system is essential for reducing mental fatigue during long sessions.
Comparing Candle Volume to Traditional Tools
Why choose this over the standard Volume Oscillator or On-Balance Volume (OBV)? The answer lies in cognitive load. When you use a separate window for volume, your brain has to constantly correlate the peak of a histogram with a specific candle several inches away on the screen. By the time you’ve matched them up, the price may have moved.
The Candle Volume Indicator MT5 removes this friction. It provides an immediate, intuitive sense of ‘weight.’ You don’t just see the price; you feel the momentum. While OBV is fantastic for spotting long-term accumulation or distribution, the Candle Volume tool is far superior for timing entries and exits based on the immediate price action.
The Limitations and Reality Check
While this indicator is a powerful ally, it is not a magic wand. It is important to remember that tick volume is a proxy for activity, not a literal count of every dollar. During massive news events like an NFP release or a central bank interest rate decision, volume will naturally skyrocket. This doesn’t always mean a trend is starting; it often just means there is high volatility and chaos. In these moments, price can whip back and forth regardless of what the volume colors suggest.
Furthermore, this tool works best when combined with a sound understanding of support and resistance. A high-volume candle in the middle of a range is much less significant than a high-volume candle hitting a major psychological level like 1.1000 on the EUR/USD.
A Disciplined Approach to Volume Trading
To get the most out of the Candle Volume Indicator MT5, start by observing it on a demo account. Watch how it reacts during different market sessions. You will quickly notice that ‘High Volume’ in the Asian session looks very different from ‘High Volume’ in the New York session. Context is everything in trading.
Successful traders in 2026 use this tool as a confirmation layer. They identify a zone of interest, wait for price to reach it, and then look to the Candle Volume Indicator to provide the ‘Green Light.’ If the volume is there, the trade is taken with confidence. If the volume is missing, they stay on the sidelines, avoiding the traps that catch less observant participants.
Ultimately, this indicator bridges the gap between raw price data and market psychology. It allows you to see the footprints of the ‘Smart Money’ as they happen, giving you a clearer path through the often-murky waters of the Forex market. By integrating volume into your visual analysis, you aren’t just looking at a chart—you’re reading the heartbeat of the market.