
Rethinking Price Boundaries in Modern Trading
In the fast-moving markets of 2026, many traders feel overwhelmed by the sheer volume of data and the noise generated by high-frequency algorithms. Finding a clear signal amidst this chaos often requires returning to the fundamentals of price action, but with a structural twist. This is where the Fractal Channel indicator for MetaTrader 4 (MT4) steps in. Rather than relying on lagging moving averages, this tool looks at the natural geometry of the market to define where the price is truly finding friction.
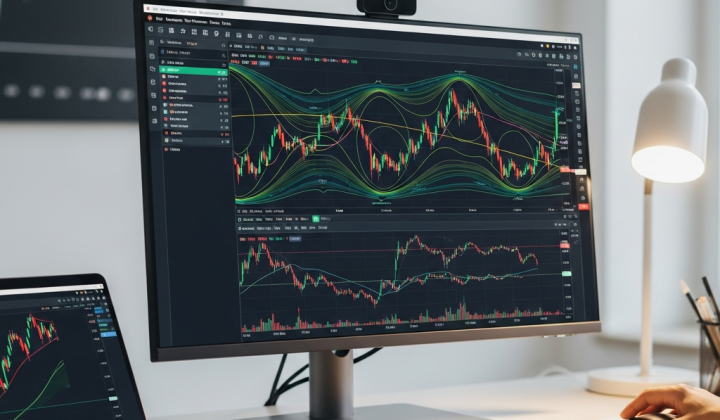
Most of us are familiar with the standard Bill Williams Fractals—those small arrows that appear above or below candles to signify a local high or low. While useful on their own, they can be messy. The Fractal Channel takes these individual points and connects them, creating a dynamic visual corridor. This corridor acts as a map, showing you exactly where the bulls and bears are drawing their lines in the sand.
The Core of the Fractal Pattern
Before we look at the channel itself, we have to understand the building blocks. A fractal is a simple five-bar pattern. For a bearish fractal to form, you need a high point preceded by two lower highs and followed by two lower highs. Conversely, a bullish fractal requires a low point surrounded by two higher lows on either side. It represents a temporary exhaustion of price movement.
When you apply the Fractal Channel indicator, the software automatically scans for these five-bar patterns and draws lines connecting the most recent highs and the most recent lows. This gives you a top and bottom boundary that updates as the market evolves, providing a real-time perspective on volatility and range.

How the Fractal Channel Transforms Your Chart
Visualizing the market as a channel rather than a series of disconnected points changes how you perceive risk. When price is trading in the middle of the Fractal Channel, it is essentially in a “no man’s land.” There is no clear advantage for either buyers or sellers. However, as price approaches the boundaries, the probability of a significant reaction increases.
Visualizing the Supply and Demand Zone
The upper line of the channel represents the current ceiling—the point where selling pressure has historically overcome buying interest. The lower line represents the floor. Unlike static support and resistance lines that you might draw manually and forget to update, the Fractal Channel is objective. It doesn’t care about your bias; it only cares about what the candles are doing. This objectivity is vital for traders who struggle with emotional decision-making.
By watching how the price interacts with these lines, you can gauge the strength of a trend. If price is hugging the upper boundary and the channel is sloping upward, you are in a strong bullish environment. If the channel is widening, volatility is increasing. If it is narrowing, the market is coiling, often signaling a massive breakout is on the horizon.
Implementing the Indicator in Your Daily Routine
Now, let’s talk about how to actually use this tool to make trading decisions. There are two primary ways to approach the Fractal Channel: as a breakout tool or as a mean-reversion tool.
Identifying the Breakout Opportunity
The breakout strategy is perhaps the most popular way to trade using fractals. The logic is straightforward: if the price manages to close outside the Fractal Channel, it indicates that the current balance of power has shifted. A candle closing above the upper fractal line suggests that the resistance has failed and a new leg up is starting. Many traders use this as a signal to enter a long position, placing their stop-loss just inside the opposite side of the channel.
Trading the Bounce: Mean Reversion Tactics
In ranging markets—which occur about 70% of the time—the Fractal Channel is an excellent tool for “buying the dip” and “selling the rip.” When the price touches the lower boundary but fails to close below it, it often signals a move back toward the center or the opposite side of the channel. This is particularly effective when combined with an oscillator like the RSI or Stochastic. If price hits the lower fractal line while the RSI is in oversold territory, you have a high-probability setup for a reversal.

Avoiding the False Break Trap
No indicator is a magic bullet. One of the biggest challenges with fractal-based trading is the “false breakout.” This happens when the price spikes above the channel, triggering buy orders, only to reverse and crash back inside the range. In 2026, with the prevalence of liquidity hunts, these traps are common.
To protect yourself, never trade a fractal break in isolation. Look for volume confirmation or wait for a retest. A true breakout usually involves the price breaking the channel, coming back to touch the outer edge of the line (which now acts as support), and then continuing its original direction. Patience is the difference between a winning trade and a frustrated exit.
Fine-Tuning Your MT4 Settings
The beauty of the Fractal Channel indicator for MT4 is its simplicity, but you can still tweak it to fit your style. Most versions of the indicator allow you to adjust the “period.” While the standard is a 5-bar fractal, increasing this to a 10 or 20-bar fractal will result in a much wider, more stable channel that filters out minor price fluctuations. This is ideal for swing traders who hold positions for several days.
For scalpers working on the 1-minute or 5-minute charts, the standard settings are usually best. However, be aware that on lower timeframes, the channel boundaries will shift frequently. You must be disciplined with your exits because a trend change on a 1-minute chart can happen in the blink of an eye.
The Psychological Edge of Structural Trading
Beyond the technical entries and exits, the Fractal Channel offers a psychological benefit. It provides structure. One of the hardest parts of trading is knowing when to do nothing. When the price is bouncing around in the middle of the channel, the indicator is essentially telling you to stay on the sidelines. It prevents the “boredom trades” that drain so many retail accounts.
By waiting for the price to reach the extremes of the channel, you are ensuring that you only engage with the market when it is at a critical inflection point. This naturally improves your risk-to-reward ratio, as your targets are often the opposite side of the channel, while your risk is contained by the recent fractal high or low.
Final Thoughts on Consistency
Success in the forex or CFD markets isn’t about finding a secret formula; it’s about finding a repeatable process that gives you a slight edge over the long term. The Fractal Channel indicator for MT4 is a robust tool because it is based on the actual mechanics of price movement rather than mathematical abstractions. Whether you use it to catch explosive breakouts or to navigate a choppy range, it provides a clear, objective framework for your trading plan.
As you integrate this into your system, remember that risk management remains king. No matter how perfect a fractal setup looks, always define your exit before you enter. Use the channel lines as your guide, but let discipline be your executioner. Over time, the clarity provided by these geometric boundaries can help turn a chaotic chart into a manageable roadmap for profit.