
The Evolution of Charting in 2026
Walking into the world of currency trading today feels a lot different than it did a decade ago. In 2026, we are surrounded by high-frequency algorithms and AI-driven sentiment analysis, yet the humble forex indicator remains a cornerstone for the individual trader. Why? Because indicators provide a visual language for the chaos of the market. They take raw price data and translate it into something our human brains can actually process. Whether you are staring at the EUR/USD or trying to catch a move on a volatile exotic pair, these tools are your eyes and ears on the ground.
However, the biggest mistake traders still make is treating an indicator like a crystal ball. It is not a magical device that predicts the future; it is a mathematical derivative of what has already happened. To win in this environment, you have to understand the mechanics behind the lines on your screen. You need to know why a moving average is lagging or why an oscillator is pinning at the top of its range. This isn’t just about clicking ‘apply’ on a template; it is about building a contextual framework for every trade you take.

Why Indicators Still Rule Markets
There is a common debate in trading circles: price action versus indicators. Some purists argue that you only need a naked chart to succeed. While that sounds noble, the reality for most of us is that indicators provide necessary guardrails. They filter out the ‘noise’ that often leads to emotional decision-making. In 2026, where market spikes can happen in milliseconds due to global news feeds, having a technical filter helps you stay grounded.
The Psychology Behind the Lines
Indicators work partly because of the math and partly because of a self-fulfilling prophecy. When millions of traders—and their bots—are looking at the 200-day Moving Average, that level becomes a psychological battleground. It is not just a calculation; it is a collective point of interest. Understanding this helps you realize that you aren’t just trading numbers; you are trading against the collective expectations of the global market. When an indicator signals a reversal, it is often reflecting a shift in the crowd’s conviction.
Categorizing Your Trading Toolkit
Not all indicators are created equal. If you fill your chart with five different tools that all measure the same thing, you are just getting ‘confirmation bias’ rather than actual confirmation. You need a balanced toolkit that covers different dimensions of market behavior. Generally, we can break these down into four main buckets: Trend, Momentum, Volatility, and Volume.
Trend Indicators: Riding the Wave
Trend indicators are the bread and butter of most successful strategies. They tell you which way the ‘big money’ is flowing. Moving Averages (MA) are the classic example here. Whether you prefer the Simple Moving Average (SMA) for long-term perspective or the Exponential Moving Average (EMA) for more responsiveness, these tools smooth out price fluctuations to reveal the underlying direction. In the current 2026 landscape, many traders are moving toward ‘Adaptive’ moving averages that adjust their sensitivity based on market speed, helping to avoid the dreaded ‘whipsaw’ in sideways markets.
Momentum Indicators: Gauging the Speed
If trend indicators tell you the direction, momentum indicators tell you how much gas is left in the tank. The Relative Strength Index (RSI) and the Stochastic Oscillator are the heavyweights here. They measure the velocity of price movements. A common misconception is that ‘overbought’ means you should sell immediately. In a strong bull market, an asset can stay overbought for weeks. Instead, savvy traders look for divergences—situations where price makes a new high but the indicator does not. This is often the first warning sign that a trend is losing steam.

Avoiding the Indicator Soup Trap
There is a phenomenon known as ‘Analysis Paralysis’ that kills more trading accounts than bad luck ever will. This happens when a trader adds so many indicators to their chart that they can no longer see the candles. You have a MACD saying ‘buy,’ an RSI saying ‘sell,’ and a Bollinger Band suggesting ‘wait.’ The result? You do nothing, or worse, you enter a trade out of pure frustration.
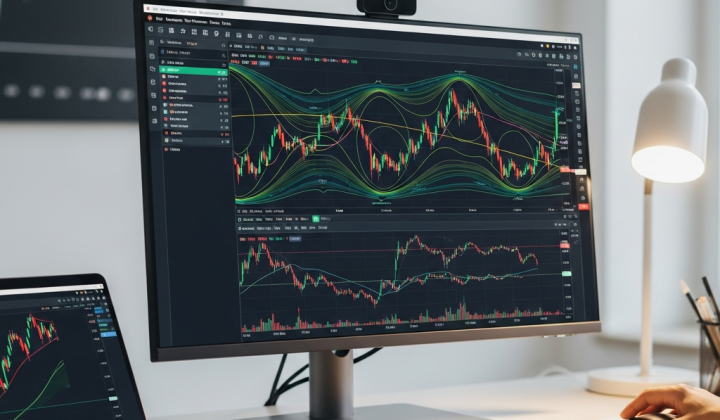
The secret to a professional-grade setup in 2026 is minimalism. Choose one trend indicator, one momentum oscillator, and perhaps one volatility measure like Average True Range (ATR). That is it. Your chart should be clean enough that the price action is still the star of the show. The indicators are merely there to provide a second opinion. If your setup looks like a Jackson Pollock painting, it is time to strip it back to the basics.
Custom vs. Standard Indicators
We are seeing a massive surge in custom-coded indicators. With modern platforms allowing for deep integration of scripts, traders are building ‘hybrid’ tools that combine multiple data points into a single visual signal. While these can be powerful, they often hide the logic from the user. Before using a custom ‘Super-Indicator’ you found online, make sure you understand the math. If you don’t know what makes the green arrow appear, you won’t have the confidence to follow it when the market gets volatile.
Building a Strategy That Works
To turn indicators into a profitable system, you need confluence. Confluence is the art of waiting for multiple independent signals to line up before pulling the trigger. For example, you might wait for price to bounce off a 50-period EMA (Trend) while the RSI is moving out of an oversold zone (Momentum) and the ATR shows that volatility is expanding (Volatility). When these three distinct ‘votes’ all point in the same direction, your probability of success increases dramatically.
It is also vital to match your indicators to your timeframe. A strategy that works on a 5-minute chart for scalping will likely fail miserably on a Weekly chart. Short-term traders need high-sensitivity indicators to catch quick movements, while swing traders need lagging indicators that filter out daily noise. Consistency comes from picking a timeframe, picking your tools, and refusing to change them every time you hit a losing streak.
Common Pitfalls to Dodge
The most dangerous habit is ‘indicator chasing.’ This is the cycle of losing a few trades, deciding the indicator is ‘broken,’ and searching for a new one. In reality, every indicator will have periods where it performs poorly—usually when the market regime changes from trending to ranging. Instead of swapping tools, learn to identify the market environment. If the market is flat, stop using trend-following tools. If the market is trending hard, stop trying to pick tops with oscillators.
Another pitfall is ignoring the fundamental backdrop. In 2026, central bank digital currencies (CBDCs) and algorithmic shifts can override any technical signal. If a major economic announcement is due, the most perfect RSI divergence in the world won’t save you from a 200-pip spike. Always use your technical indicators in harmony with the broader economic calendar.
The Path Forward
Becoming a master of forex indicators isn’t about finding a ‘secret’ setting. It is about discipline and observation. Spend time watching how price reacts to certain levels on your chosen indicators. Backtest your ideas over hundreds of trades to see the win rate and, more importantly, the drawdown. The goal is to reach a state where you aren’t ‘calculating’ your trades anymore; you are recognizing patterns that you have seen a thousand times before. In the fast-paced world of 2026 forex trading, that kind of intuitive clarity is the ultimate competitive advantage.