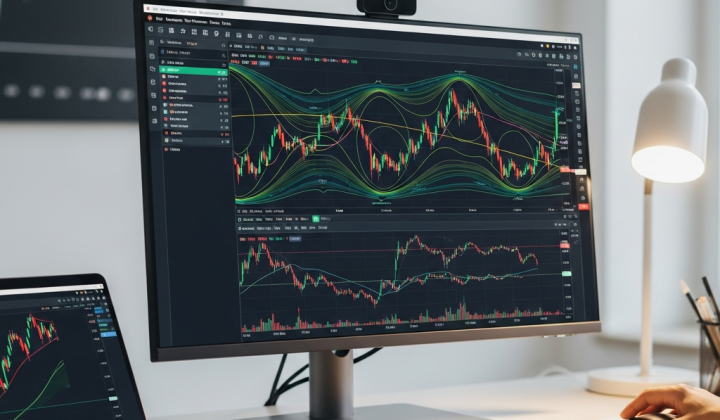

The Hidden Map of the Forex Market
Have you ever watched a currency pair plummet, only to see it suddenly stop and bounce back as if it hit an invisible wall? In the chaotic world of forex trading, these moments aren’t accidents. They are often the result of thousands of traders—and even more high-frequency algorithms—looking at the exact same price levels. Among the most reliable tools for finding these invisible boundaries is the pivot point calculator.
While many indicators look at the past to tell you what happened, pivot points are predictive. They use the price action of the previous day to map out where the action is likely to happen today. It’s about finding the ‘fair value’ of an asset and then projecting where the extremes might lie. If you’ve been struggling to find entry and exit points that don’t feel like guesswork, understanding how these calculations work is a game-changer.
What Exactly is a Pivot Point?
At its core, a pivot point is a technical analysis indicator used to determine the overall trend of the market over different time frames. The pivot point itself is simply the average of the high, low, and closing prices from the previous trading period. If the market is trading above the pivot point, it’s generally considered a bullish sign. If it’s below, the bears are in control.
But the real magic happens in the levels surrounding that central pivot. These are known as support (S) and resistance (R) levels. A pivot point calculator takes that central price and extrapolates several layers of potential turning points. Traders use these levels to predict where a trend might stall or reverse.

The Anatomy of the Calculation
You don’t need to be a math genius to use these, but knowing how the sausage is made helps you trust the tool. The standard calculation, often called the ‘Floor Pivot,’ is the most common. It follows a straightforward logic:
- Pivot Point (P): (High + Low + Close) / 3
- First Resistance (R1): (2 x P) – Low
- First Support (S1): (2 x P) – High
- Second Resistance (R2): P + (High – Low)
- Second Support (S2): P – (High – Low)
Think of the central pivot as the baseline. R1 and S1 are the first hurdles the market faces. If price breaks through R1, it’s showing significant strength. If it hits R2, the market is often considered ‘overextended,’ and a pullback becomes highly probable. It’s all about measuring the elasticity of price movement based on the previous day’s volatility.
Why Different Formulas Exist
Not every trader sees the market the same way, which is why a good pivot point calculator offers more than just the standard formula. Depending on your trading style, you might find one of these variations more effective:
The Fibonacci Method
This is a favorite among swing traders. It uses the same central pivot but applies Fibonacci ratios (like 38.2% and 61.8%) to the previous day’s range to determine the S and R levels. Because so many traders watch Fibonacci levels, these points often become self-fulfilling prophecies.
The Camarilla Equation
If you are a day trader or a scalper, Camarilla might be your best friend. Developed by Nick Scott in the late 80s, it focuses on the idea that prices have a tendency to revert to the mean. It produces much tighter levels, specifically designed for those looking to capture small, quick moves within a range.
Woodie’s Pivot Points
Woodie’s version puts more weight on the closing price of the current period. It’s a bit more reactive to recent price action than the standard floor pivots. Many traders find this helpful in fast-moving markets where the opening price might be vastly different from the previous close.

Putting the Calculator to Work
So, how do you actually use this in a live session? Imagine you are looking at the EUR/USD. The calculator tells you the pivot point is at 1.0850. The current price is 1.0870. Right away, you know the intraday bias is bullish.
You notice that R1 is sitting at 1.0910. Instead of chasing the price higher, you wait. As the price approaches 1.0910, you look for signs of exhaustion—perhaps a long wick on a candlestick or a divergence in the RSI. If the price fails to break 1.0910, you have a high-probability setup for a short trade back down to the central pivot. Conversely, if it blasts through 1.0910 with high volume, you might look for a ‘retest’ of that level to go long, targeting R2.
The Psychology of the Crowd
Why do these levels work? It’s not because the math is mystical. It’s because of institutional behavior. Large banks and hedge funds use pivot points to manage their orders. When a large buy order is placed, it’s often broken up and executed near these key levels to ensure better pricing. When everyone—from the retail trader in their bedroom to the quant at a desk in London—is looking at the same S1 level, it naturally becomes a zone of high liquidity.
In 2026, where algorithms dominate the majority of trade volume, these levels are more relevant than ever. Bots are programmed to recognize these mathematical thresholds. When a price hits a calculated S3 level, it often triggers automated buy programs because the statistical probability of a bounce is so high.
Common Pitfalls to Avoid
While a pivot point calculator is a powerful ally, it isn’t a crystal ball. One of the biggest mistakes traders make is using these levels in a vacuum. If there is a major central bank announcement or a surprise geopolitical event, the ‘math’ of the previous day often goes out the window. High volatility can shred through support and resistance levels like they aren’t even there.
Another mistake is ‘level hunting.’ This is when a trader forces a trade just because the price is near a pivot level, even if the overall market context is messy. Always look for confluence. If a pivot level aligns with a major moving average or a previous week’s high, the strength of that level is doubled.
The Advantage of Automation
In the past, traders had to manually calculate these numbers every morning before the opening bell. Today, using an online pivot point calculator or an MT4/MT5 indicator takes seconds. This speed allows you to focus on what actually matters: execution and risk management.
By automating the calculation, you remove human error. A single mistyped digit in your manual math could lead to a stop-loss that is 20 pips off where it should be. In a game of margins, that’s an unacceptable risk. A reliable calculator ensures that your ‘map’ for the day is drawn with precision.
Final Thoughts for the Modern Trader
Trading is essentially a game of probabilities. Your goal isn’t to be right 100% of the time; it’s to find an edge that puts the odds in your favor. Pivot point calculators provide that edge by highlighting the zones where the most significant battles between buyers and sellers are likely to occur.
Whether you prefer the conservative nature of Standard pivots or the aggressive levels of Camarilla, incorporating these numbers into your daily routine provides a sense of structure. It transforms a blank chart into a tactical environment. Don’t just trade the price—trade the levels where the world is watching.