Understanding the Fuel Behind Market Moves
In the fast-paced world of forex trading, price action often takes center stage. We watch candles form, patterns emerge, and trends develop. But there is a silent engine running beneath the surface that many retail traders ignore: volume. If price is the car, volume is the gasoline. Without enough fuel, even the most promising breakout will eventually stall and roll backward.
The Volume with Custom Moving Average indicator for MT4 is designed to bring this hidden data into the light. By combining raw volume data with a smoothing moving average, it provides a clear, objective way to see if a price move has the necessary participation to sustain itself. In 2026, where algorithmic trading dominates the landscape, being able to spot ‘real’ participation versus ‘noise’ is more critical than ever.
Defining the Volume with Custom Moving Average Indicator
At its core, this tool is a hybrid technical indicator. It doesn’t just show you how much activity is happening; it gives you a benchmark to measure that activity against. Most standard volume indicators just show a series of bars at the bottom of the screen, leaving the trader to guess whether a particular spike is actually significant.
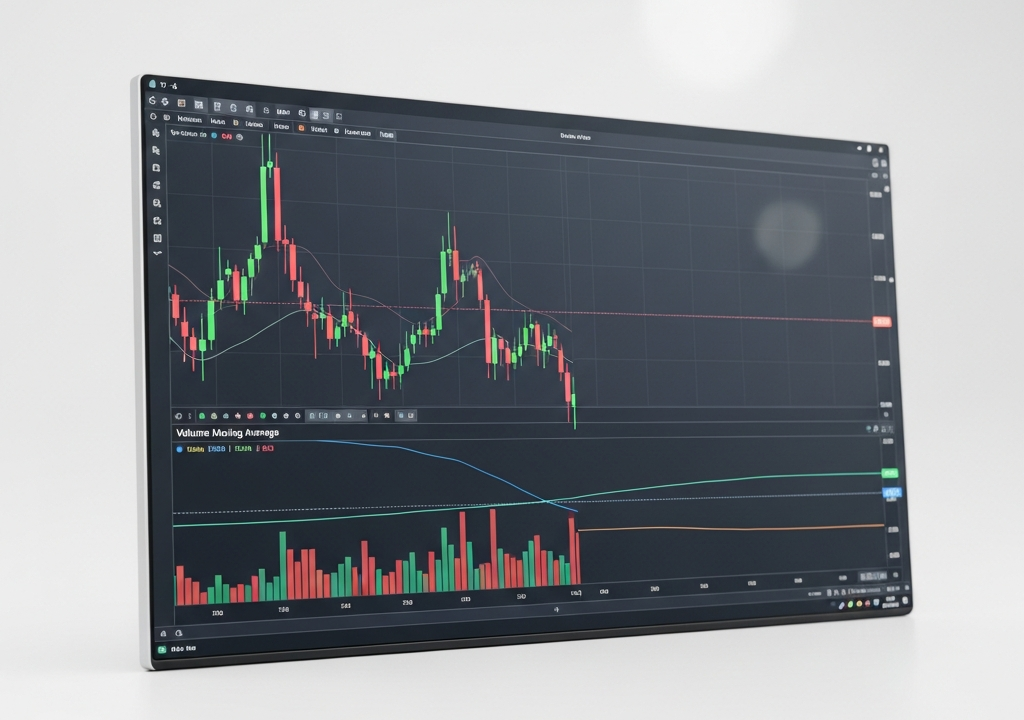
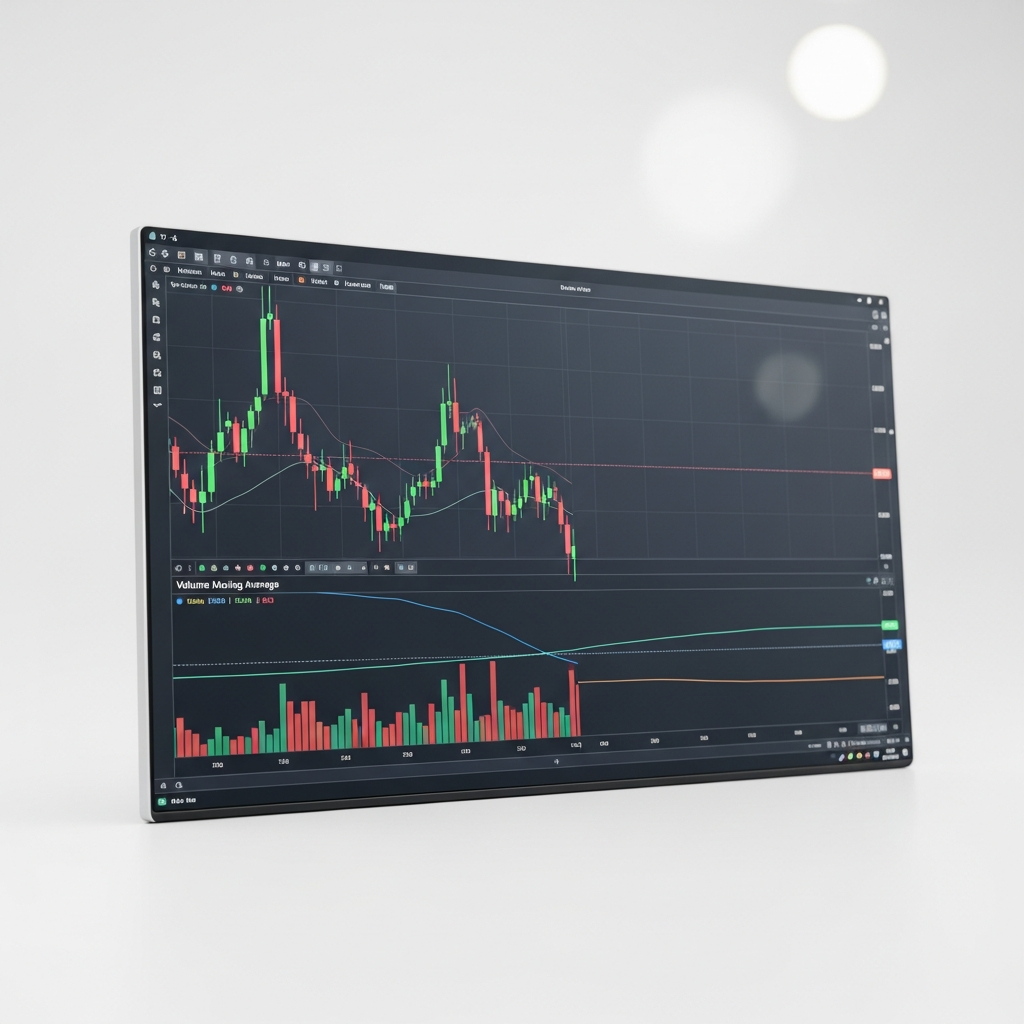
This indicator solves that problem by overlaying a customizable Moving Average (MA) directly onto the volume histogram. This creates a dynamic threshold. When volume bars rise above this line, it signals that the current market activity is higher than the recent average, suggesting that institutional players or a large cluster of retail traders are actively pushing the price.
The Visual Components
- Green Bars: These appear when the current volume is higher than the volume of the previous candle. It signifies growing interest.
- Red Bars: These appear when the volume is lower than the previous candle, indicating a potential cooling off or a lack of participation.
- The MA Line: This is the ‘Custom’ part of the indicator. It averages the volume over a set period, providing a visual ‘line in the sand’ for what constitutes normal vs. abnormal activity.
How the Logic Works Under the Hood
It is worth noting that in the MetaTrader 4 environment, ‘Volume’ usually refers to tick volume. This counts the number of price changes within a specific period. While this isn’t the same as the total dollar amount traded (which is only available in centralized markets like stocks), tick volume is highly correlated with actual liquidity and volatility in the forex market.
The indicator pulls this tick data directly from your broker’s feed. It then applies a mathematical formula—the Moving Average—to that data. If you set the MA to 20, the line represents the average volume of the last 20 candles. This creates a context that raw bars alone cannot provide. You aren’t just looking at volume; you are looking at volume *relative* to recent history.
Customizing the Settings for Your Style
One of the reasons this indicator is a staple for many professional desks is its flexibility. You can tweak the settings to match the specific pair or timeframe you are trading.
MA Period
The MA Period is the most vital setting. A shorter period (like 5 or 10) makes the line very reactive, which is great for scalpers looking for quick bursts of momentum. A longer period (like 50 or 100) creates a much smoother benchmark, which is better for swing traders who want to ensure a trend has long-term backing.
MA Method
You can choose between Simple (SMA), Exponential (EMA), Smoothed (SMMA), or Linear Weighted (LWMA). Most traders stick with the Simple Moving Average for volume, but an Exponential Moving Average can be useful if you want the indicator to be more sensitive to the most recent volume spikes.
MA Shift
This allows you to move the MA line forward or backward on the horizontal axis. While rarely used by beginners, advanced traders sometimes shift the line to account for specific cyclical patterns in market opening hours.
Strategic Application: Validating Breakouts
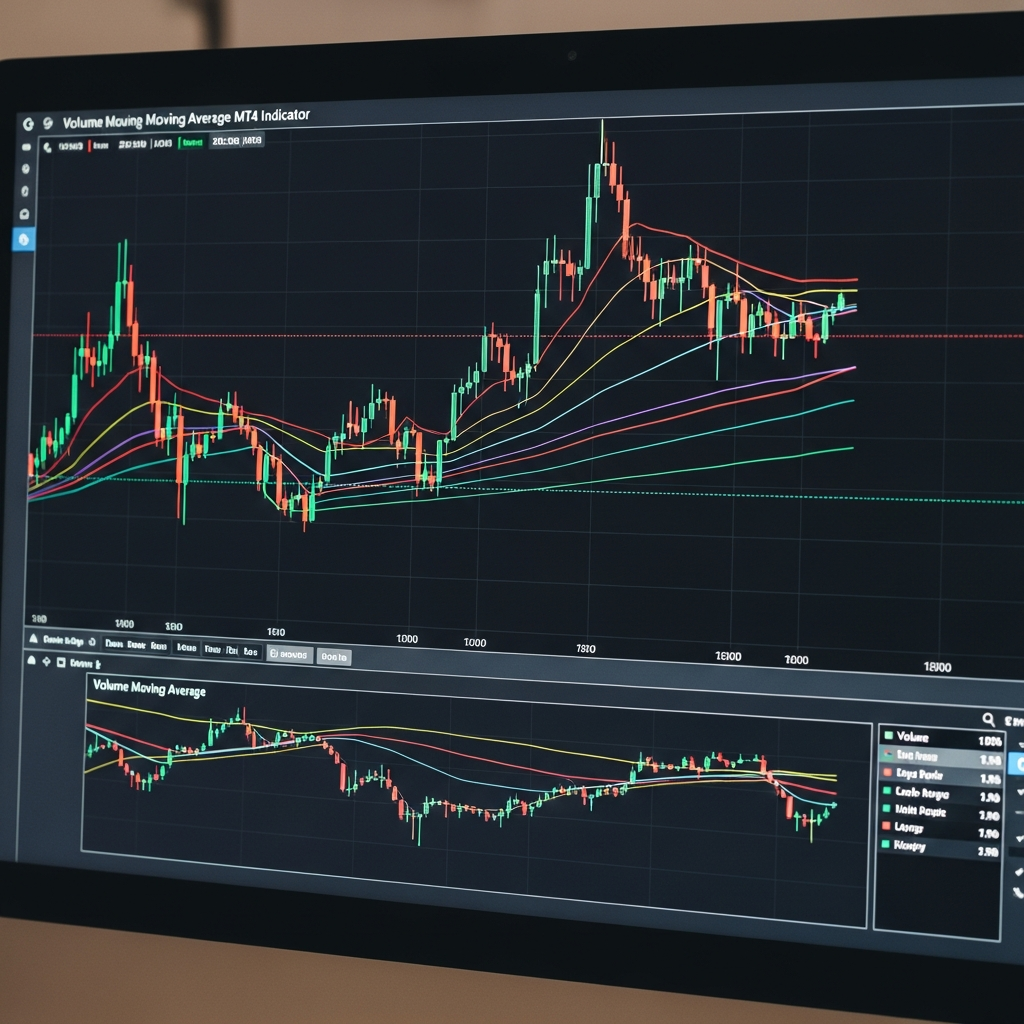
The most powerful way to use the Volume with Custom Moving Average is as a filter for breakouts. We have all experienced the ‘fakeout’—price breaks out of a consolidation zone, you enter, and then it immediately reverses. Often, if you look at the volume during those fakeouts, it was low.
A high-probability breakout occurs when the price moves past a key level AND the volume bar spikes significantly above the Moving Average line. This shows that the breakout is being supported by a surge in participation, making it much more likely to hold and continue.
Trading Setups: Buy and Sell Logic
Using this indicator isn’t about following a single line; it’s about finding confluence. You should never trade based on volume alone. Instead, use it to confirm your existing price action or indicator-based strategies.
The Long (Buy) Setup
- Identify a bullish price signal, such as a break above resistance, a bullish engulfing pattern, or a trendline bounce.
- Look at the Volume indicator. Is there a green bar?
- Confirm that the volume bar has surged above the Moving Average line.
- Open the buy order once the candle closes, confirming both the price move and the volume spike.
- Place your stop loss below the recent swing low or the entry candle’s wick.
The Short (Sell) Setup
- Identify a bearish price signal, such as a break below support, a head and shoulders completion, or a bearish pin bar.
- Check the Volume indicator for a spike. Even if the bar is red (meaning lower than the previous bar), the key is whether it is *above the MA line*.
- If the volume is significantly higher than the average, it suggests strong selling pressure.
- Execute the sell order.
- Place your stop loss above the entry candle or the nearest resistance level.
The Psychology of Volume Spikes
Why does this work? Markets move because of an imbalance between buyers and sellers. When volume spikes above the average, it means a large number of orders are hitting the market at once. This usually happens when institutions—banks, hedge funds, and large commercial interests—decide to enter or exit positions. By following these volume spikes, you are essentially ‘piggybacking’ on the moves of the ‘Smart Money’.
Conversely, if price is moving up but volume is falling below the Moving Average, it’s a sign of ‘divergence’. It suggests the move is weak and might be a trap. This is often seen at the end of a trend, known as an exhaustion move.
Final Thoughts on Volume Analysis
The Volume with Custom Moving Average indicator for MT4 is a secondary confirmation tool that adds a layer of professional-grade analysis to a retail trading setup. It doesn’t tell you *where* the price is going—the price action does that—but it tells you how much *conviction* is behind that movement. By ignoring volume, you are essentially trading with one eye closed. Integrating this tool allows you to filter out weak signals and focus on the high-momentum opportunities that offer the best risk-to-reward ratios. Remember to always practice on a demo account first to understand how volume fluctuates during different market sessions, such as the London and New York overlaps.